
The Effects of Artificial Intelligence and Robotics on Employment and Wages in Korean Manufacturing Firms
1 Introduction
Disruptive technologies such as artificial intelligence (AI) and robotics are currently the most hotly debated forms of automation (Acemoglu & Restrepo, 2018; Aghion et al., 2019; Growiec, 2022). Both technologies are capable of performing tasks with minimal or no human intervention. As noted by Delmar S. Harder, vice chairman of Ford Motor Company, in 1947, automation meant “the increasing use of electromechanical, hydraulic, and pneumatic machinery” (Noble, 1984, p. 66). More recently, the National Academies of Sciences, Engineering, and Medicine (2017, p. 20) defines it as “the technique, method, or system of operating or controlling a process by highly automatic means, as by electronic devices, reducing human intervention to a minimum.” Automation is thus deeply tied to replacing human labor across a wide range of tasks (Acemoglu & Restrepo, 2018, p. 48).
The impact of AI and robotics on jobs remains controversial (e.g., Brynjolfsson & McAfee, 2014; Gordon, 2018; Bloom et al., 2020; Acemoglu & Restrepo, 2019). Empirical studies have so far found surprisingly little evidence of a net decline in employment due to automation (Autor, 2015). The productivity effects of computer technology diffusion seem to have been particularly pronounced between 1995 and 2005 but have slowed down since (Cardona et al., 2013). This may be because some forces counterbalance the impact of automation on employment. These include increased labor demand due to lower production costs, the creation of tasks leveraging human comparative advantages, and complementarities between labor and capital (Aghion et al., 2022). As a result, automation technologies have both labor-saving and employment-generating effects, with the net impact on employment and wages depending on the relative strength of these opposing forces (Acemoglu & Restrepo, 2019). Rather than eliminating jobs entirely, automation technologies often reshape labor markets. The employment effects of automation are likely context dependent, varying across empirical settings rather than conforming to broad generalizations.
Korea’s manufacturing sector exhibits one of the highest global levels of robot adoption and automation, particularly in the electronics and automotive industries (IFR, 2023). Thus, analyzing the employment and wage effects of robotics and AI in Korean manufacturing firms is critical. Moreover, since 2017, Statistics Korea’s Survey of Business Activities has collected firm-level data on the adoption and development of nine core technologies associated with the Fourth Industrial Revolution, including AI and robotics. This dataset allows us to move beyond aggregate industry-level analyses to examine the firm-level economic effects of automation, specifically, its impact on employment and wages in Korea’s manufacturing sector.
In this context, this article empirically examines the effects of two automation technologies – namely, AI and robotics – on employment and wages in Korean manufacturing firms. First, we analyze how adopting AI and robotics affects employment using balanced panel data from the 2017–2022 Survey of Business Activities. Given robotics’ widespread implementation and AI’s recent penetration in Korean manufacturing firms, we expect technology-specific employment effects. However, the lack of individual wage data in the firm-level dataset limits our ability to analyze wage effects. To overcome this, we examine how the industry-level diffusion of AI and robotics affects individual workers’ hourly wages. Specifically, we link industry-level exposure from firm-level data to worker-level employment data from the 2018–2023 Local Area Labor Force Survey (National Version), which provides cross-sectional individual-level information. Similar to the effects on employment, we anticipate technology-specific effects on wages.
The remainder of this article is structured as follows. Section 2 reviews the relevant empirical literature. Section 3 describes the data sources and outlines the empirical methodology, followed by a detailed discussion of the findings. Finally, Section 4 summarizes the key results and presents concluding remarks.
2 Literature Review
Recent disruptive innovations in automation technologies have sparked intense debate over their broader socioeconomic effects, particularly on economic growth, productivity, employment, and income inequality (e.g., Brynjolfsson & McAfee, 2014; Acemoglu & Restrepo, 2019; Aghion et al., 2019; Agrawal et al., 2019; Gordon, 2018; Gries & Naudé, 2018). Despite this growing body of empirical and theoretical work, mainstream economic theory continues to offer a more general view, maintaining that technological change and innovation are fundamental drivers of economic growth (Solow, 1957; Romer, 1990).
However, growing empirical evidence suggests that the employment effects of automation may be far more complex and uneven than such theory implies. In response to these complexities, the task-biased technological change (TBTC) framework has emerged as a key approach to understanding the differentiated employment effects of automation. Regarding the employment effects of automation technologies, the literature on TBTC argues that production processes comprise diverse tasks that workers and machines perform depending on their comparative advantages (Autor et al., 2003; Acemoglu & Autor, 2011; Acemoglu & Restrepo, 2018). Automation thus extends the range of tasks that machines can perform, affecting middle-skilled workers in particular (Autor & Dorn, 2013; Josten & Lordan, 2020).
At the same time, automation technologies – especially AI and robotics – also generate new employment opportunities through productivity gains, making their net employment effect uncertain (Acemoglu & Restrepo, 2019). Additionally, TBTC suggests returns on specific skills, with analytical, cognitive, and social skills becoming increasingly valuable as automation advances (Deming, 2017; Deming & Khan, 2018; Edin et al., 2022). Studies in the US indicate a growing complementarity between cognitive and social skills and highlight the increasing importance of the latter as automation progresses (Autor, 2014; Borghans et al., 2014; Weinberger, 2014).
Empirical findings regarding automation’s employment and wage effects vary depending on the analytical level and context. Industry-level analyses yield mixed results: automation may reduce labor demand in competing firms, but productivity gains and reduced wages could stimulate broader employment (Acemoglu et al., 2020). While Klenert et al. (2023) find positive industry-level effects on employment, Acemoglu and Restrepo (2020) report a negative impact. In contrast, analyzing robotics adoption in 17 advanced economies from 1993 to 2007, Graetz and Michaels (2018) identify positive associations with productivity and skilled labor demand without negative total employment effects. At the national level, Dauth et al. (2021) examine the effect of industrial robots on regional labor markets in Germany from 1994 to 2014, finding that although robots displace jobs in the manufacturing sector, this effect is largely offset by job creation in the service sector. This suggests that productivity gains from automation can drive labor reallocation across sectors at the national level.
However, firm-level findings frequently indicate positive employment effects from robot adoption. Firms leveraging automation often expand employment due to competitive advantages and market expansion (Graetz & Michaels, 2018). Similar outcomes emerge from empirical studies of French, Dutch, Spanish, and Danish firms, which reveal that employment growth is correlated with automation adoption (Acemoglu et al., 2020; Aghion et al., 2020; Bessen et al., 2020; Koch et al., 2021; Humlum, 2021).
Thus, employment effects remain nuanced and context dependent, varying significantly across firms and industries (Aghion et al., 2020). Moreover, empirical analyses often rely on tangible robot assets due to the availability of industry-specific data from the International Federation of Robotics (IFR, 2023). In doing so, they overlook complementary digital technologies that are increasingly integrated with robotic systems. More comprehensive measures are therefore needed (Seamans & Raj, 2018; Jurkat et al., 2023).
Empirical research on AI’s economic effects remains limited by the scarcity of firm-level data. Current studies often use job postings and patents as proxies for AI exposure (e.g., Acemoglu et al., 2022; Babina et al., s2024; Webb, 2020), suggesting potential positive effects on productivity and modest effects on employment (Acemoglu et al., 2022) or high growth in sales, employment, and market value driven by increased product innovation (Babina et al., 2024). Webb (2020) further finds that AI reduces 90:10 wage inequality but has little effect at the very 1% top, differentiating AI’s wage effects from those of other automation technologies.
Overall, empirical studies do not generally support the notion that automation leads to large-scale job losses (Autor, 2015; Acemoglu et al., 2022). Instead, automation’s economic outcomes depend on the balance of positive and negative effects at the firm and industry levels, market structure, and firms’ adaptive capabilities. Although research often finds positive effects on productivity and employment at the firm level, findings concerning the industry-level impacts are less conclusive and, at times, contradictory. Given that AI adoption is still in its early stages, its long-term economic effects are yet to be fully understood. Moreover, automation’s impact on wages remains mixed and underexplored, highlighting the need for further research, particularly on its effects on low- and middle-skilled workers (Jurkat et al., 2023).
3 Empirical Analysis
3.1 Data
3.1.1. Effects on Employment
This study estimates the employment and wage effects of automation technologies in Korean manufacturing firms from the late 2010s to the present, focusing on the utilization and development of AI and robotics. The primary dataset for analyzing employment effects is Statistics Korea’s Survey of Business Activities (2017–2022), which has been published annually since 2006 and provides data on industrial enterprises in Korea with at least 50 employees and a minimum capital of 300 million KRW. Conducted through questionnaires and administrative data, it includes detailed firm-level variables such as organizational structure, financial performance, research and development activities, intellectual property, and management direction. This comprehensive dataset facilitates the detailed firm-level analysis of how AI and robotics technologies impact employment dynamics (Statistics Korea, 2024a).
Since 2017, the Survey has included questions about the “development and utilization of technologies related to the Fourth Industrial Revolution” under the “Management Direction of Companies” category. Specifically, these concern AI, robotics, the Internet of things (IoT), cloud computing, big data, 5G, blockchain, 3D printing, and augmented reality (AR)/virtual reality (VR). By using direct survey data from Korean manufacturing firms, this approach overcomes the limitations of previous studies that relied on indirect proxies like patent data or skill requirements in job postings. Patent data may primarily reflect technological development rather than actual adoption (Damioli et al., 2021), while job postings may indicate skill demand without directly capturing firm-level implementation (Alekseeva et al., 2021).
However, a limitation of the Survey of Business Activities is its unclear distinction between technology development and utilization. Consequently, our study regards firms as adopters if they reported engaging in either activity. We then construct the automation technology variable as a dummy indicator reflecting recent firms’ investments in AI- and robotics-driven automation, instead of their long-term capital accumulation (Czarnitzki et al., 2023, p. 193).
3.1.2. Effects on Wages
The firm-level dataset provides only total labor costs, including additional components such as retirement benefits, and lacks detailed individual wage data. To overcome this, we incorporated the 2018–2023 Local Labor Force Survey (National Version), a cross-sectional dataset that includes individual wage details along with demographic, social, and job characteristics (Statistics Korea, 2024b). Conducted semi-annually since 2013, this survey provides the dataset used in our analysis, with the second half of the survey period serving as the representative timeframe. This dataset still enables a detailed wage analysis despite lacking direct automation-related technology questions.
Unlike previous research that relies on industrial robot stock data from the International Federation of Robotics, this study uses firm-level AI and robotics adoption data from the Survey of Business Activities to estimate the effects of automation on employment. In addition, it leverages the Survey to construct industry-specific exposure indices at the two-digit manufacturing classification level to analyze automation’s impact on wages. Although the Survey does not explicitly distinguish between technology development and utilization, this distinction is less critical at the industry level due to mutual dependency and spillover effects in manufacturing (Cho et al., 2023). Therefore, we considered firms that engage in either activity adopters. Furthermore, we created an industry-specific AI and robotics exposure index based on the proportion of adopting firms in each manufacturing subsector.
3.2 Estimation Models
3.2.1. Effects on Employment
To examine the employment effects of automation technologies, specifically AI and robotics, we specified the following reduced-form panel regression model:
Yit=α+βXit+γZit+δIi+θi+μt+εit (Eq. 1)
where i and t represent individual firms and years, respectively. Yit denotes log employment or employment growth for firm i in year t, covering total employment, including both blue- and white-collar workers as well as full-time and part-time employees. Zit is a dummy variable indicating firm adoption of AI or robotics technologies in a given year. Ii controls for industry-specific effects, capturing variations across industries that might influence employment independently of firm-specific factors. θi denotes firm fixed effects to address time-invariant unobserved heterogeneity, and μt represents year fixed effects accounting for macroeconomic trends and common shocks. εit is the idiosyncratic error term.
The control variables (Xit) include both qualitative and quantitative measures. Qualitative variables capture institutional and strategic factors, including strategic alliances, which reflect forward-looking entrepreneurial activity (Emami et al., 2022), foreign ownership (Almeida, 2003), chaebol affiliations (Lee et al., 2010), compensation structures (van Herpen et al., 2004), outsourcing strategies (Falk & Koebel, 2002), and regional dummy variables to address geographic labor market disparities. Additionally, quantitative variables capture firm-level economic performance, including exports as a share of sales (Aw & Hwang, 1995), log real sales as a proxy for firm size adjusted for inflation using a 2020 gross domestic product deflator (Banerjee & Jesenko, 2016), patents per capita for innovation capacity (Brynjolfsson & Hitt, 2003), the ratio of regular to total employment, and the share of female employment to reflect structural labor market dynamics (Blau & Kahn, 2017; Tam & Xu, 2024).
3.2.2. Effects on Wages
To analyze wage effects, we employed Mincer’s (1958) wage equation, estimating how manufacturing workers’ hourly wages are influenced by their industry’s exposure to automation:
Yit=α+βXit+γZjt-1+δj+θt+εit (Eq. 2)
where i denotes individual workers, j industry sectors, and t years. Yit is log hourly real wages, adjusted using the 2020 consumer price index. Industry (δj) and year dummies (θt) control for fixed industry characteristics and macroeconomic fluctuations, respectively. εit represents the error term.
Demographic, social, and job characteristic variables (Xit) include both qualitative and quantitative variables. The qualitative variables are: gender, with male as the reference (Blau & Kahn, 2017); marital status, categorized as single, married, and others, with the latter serving as the reference (Hill, 1979); and education level, classified into high school or less (the reference group), college, university, and graduate degree or higher (Freeman, 1986). In addition, we categorized occupations into managerial and professional, clerical, sales and service workers, production workers, elementary occupations, and others as the baseline reference. Employment type distinguishes between regular jobs and temporary or other employment types, with the latter serving as the baseline (Eurofound, 2019). The quantitative variables include age, age squared, tenure, and tenure squared, accounting for nonlinear wage effects related to experience and job tenure (Mincer, 1974; Szymczak et al., 2022).
The key explanatory variable, Zjt-1, measures industry-level exposure to AI and robotics and was constructed using firm-level adoption data aggregated at the two-digit industry classification level. 1 These measures represent the percentage of firms in a given industry that have adopted AI and robotics technologies relative to all firms in that industry at the two-digit manufacturing classification level. To address endogeneity concerns, we applied a one-year lag structure following the approach of Szymczak et al. (2022). This assumption enables a more causal interpretation of the effects of industry-level exposure to automation on individual labor market outcomes.
Additional variables include an occupational offshorability index, derived from Acemoglu and Autor (2011) and applied using data from the 2020 Korea Network for Occupations and Workers. As in Webb’s (2020) study, this accounts for the effects of globalization and remote work on wages. For robustness checks, the analysis incorporates the computerization score developed by Frey and Osborne (2017) under the US Standard Occupational Classification (SOC), which assesses the susceptibility of occupations to automation using expert assessments, O*NET occupational data, and statistical techniques. In addition, we included Webb’s (2020) occupational exposure measures for AI (Webb-AI) and robotics (Webb-Robot), which link technology characteristics to occupational characteristics using patent data. These indicators were matched to the three-digit Korean Standard Classification of Occupations (KSCO) via the SOC–KSCO linkage, further refining the analysis of the impact automation on wages.
3.3 Estimation Methods
3.3.1. Employment Effects
The 2017–2022 Survey of Business Activities is designed to enable panel data analysis. To ensure robustness, we constructed a balanced panel dataset, restricting the sample to firms maintaining the same primary industry classification and having complete observations throughout the period (2017–2022). This restriction prevents potential biases from arising from inconsistent firm data over time.
In panel data regression, selecting an appropriate estimation model is critical for addressing time-invariant heterogeneity and endogeneity concerns. The fixed effects model effectively controls for unobserved firm-specific characteristics that remain constant over time, mitigating omitted variable bias. Meanwhile, the random effects model accommodates time-invariant explanatory variables. To integrate the benefits of both models, we employed the Hausman-Taylor estimator (HTE), correcting potential correlations between regressors and the error term through instrumental variables derived from within the model. Unlike the fixed effects model, the HTE enables the estimation of time-invariant variables while still controlling for unobserved individual heterogeneity. Moreover, the first-difference model eliminates firm-specific fixed effects, ensuring that the analysis focuses on short-term employment fluctuations influenced by time-varying variables.
A key concern is endogeneity between firms’ AI/robotics adoption and employment outcomes (Czarnitzki et al., 2023), which may arise from reverse causality or omitted variable bias linked to broader digitalization efforts. To address this, we utilized two instrumental variables. The first, industry-level AI/robotics exposure, captures industry-wide technology diffusion independently of individual firms’ employment decisions, thus helping to mitigate reverse causality. The second instrument is firms’ adoption of complementary Fourth Industrial Revolution–related technologies, excluding AI and robotics. These infrastructure technologies are strongly correlated with AI/robotics adoption but affect employment indirectly (DeStefano et al., 2020; Cho et al., 2023), mitigating omitted variable bias.
We addressed selection bias arising from unobserved heterogeneity between adopters (treatment group) and non-adopters (control group) using entropy balancing (EB), following Czarnitzki et al. (2023). EB assigns weights to match the covariate distributions of treatment and control groups, ensuring balance in means, standard deviations, and skewness (Hainmueller, 2012). 2 This method produces a statistically comparable control group, reducing bias while offering greater flexibility than propensity score matching, which is more sensitive to outliers. As a result, the estimated effects of automation on employment are less likely to be confounded by structural group differences, which mitigates potential endogeneity bias and emphasizes the net effect of AI and robotics adoption on employment. Moreover, since panel fixed-effect instrumental variable approaches often yield large estimates, as noted by Czarnitzki et al. (2023), we combined EB with HTE for robustness checks and comparisons.
3.3.2. Effects on Wages
We analyzed the effects of automation on wages using cross-sectional pooled employment data at the worker level, employing pooled ordinary least squares. Potential endogeneity concerns, such as reverse causality or omitted variables affecting both wages and automation adoption, are less pronounced at the micro-level because individual wages are unlikely to drive industry- or occupation-level automation decisions (Szymczak et al., 2022). To further mitigate endogeneity, we lagged industry- or occupation-level automation exposure variables by one year.
In addition, clustering of automation exposure at the industry or occupational level may cause autocorrelation, potentially leading to an underestimation of standard errors (Moulton, 1990). To correct this, we employed cluster-robust standard errors, which ensure that our estimates are reliable provided that the industry or occupation level sample size is sufficiently large, as recommended by prior studies (Nichols & Schaffer, 2007; Szymczak et al., 2022).
3.4 Descriptive Statistics
3.4.1. Trends in the Development and Utilization ofAutomation Technology
As noted above, the 2017 Survey of Business Activities incorporates a question on the development and utilization of Fourth Industrial Revolution technologies. These technologies include the IoT, cloud computing, big data, mobile technologies (5G), AI, blockchain, 3D printing, robotics, and AR/VR. Among them, AI, robotics, computer-aided design and manufacturing, software, and 3D printing are particularly critical as general-purpose technologies or key enabling technologies that complement advanced manufacturing processes. Their adoption has a direct impact on productivity, product quality, and production flexibility (Goldfarb et al., 2020). The interconnection between mechanical equipment, data collection, advanced software, and communication networks highlights the importance of integrating data-driven intangible assets into the production process (Haskel & Westlake, 2017). Thus, these nine technologies are either directly or indirectly linked to broader automation trends.
Table 1 presents the number of firms developing and utilizing these nine automation-related technologies, based on data compiled and published by Statistics Korea. 3 The figures in parentheses indicate the proportion of firms that adopted each technology as a percentage of all manufacturing firms, serving as an industry-level exposure indicator that reflects the extent of technological integration in a sector.
Table 1: Trends in the Development and Utilization of Automation Technologies in Manufacturing Firms (2017–2022)
|
2017 |
2018 |
2019 |
2020 |
2021 |
2022 |
|
|
Manufacturing firms total |
6,113 (1.0) |
6,288 (1.0) |
6,150 (1.0) |
6,150 (1.0) |
6,150 (1.0) |
6,250 (1.0) |
|
Automation-relatedtechnologies total |
410 (0.067) |
627 (0.100) |
661 (0.107) |
661 (0.107) |
746 (0.121) |
737 (0.118) |
|
IoT |
138 (0.023) |
228 (0.036) |
205 (0.033) |
205 (0.033) |
230 (0.037) |
241 (0.039) |
|
Cloud |
92 (0.015) |
172 (0.027) |
229 (0.037) |
229 (0.037) |
261 (0.042) |
249 (0.040) |
|
Big data |
108 (0.018) |
164 (0.026) |
167 (0.027) |
167 (0.027) |
193 (0.031) |
186 (0.030) |
|
Mobile (5G) |
139 (0.023) |
143 (0.023) |
108 (0.018) |
108 (0.018) |
117 (0.019) |
99 (0.016) |
|
AI |
48 (0.008) |
108 (0.017) |
133 (0.022) |
133 (0.022) |
159 (0.026) |
167 (0.027) |
|
Blockchain |
12 (0.002) |
15 (0.002) |
9 (0.001) |
9 (0.001) |
14 (0.002) |
10 (0.002) |
|
3D printing |
89 (0.015) |
133 (0.021) |
139 (0.023) |
139 (0.023) |
136 (0.022) |
121 (0.019) |
|
Robotics |
65 (0.011) |
126 (0.020) |
167 (0.027) |
167 (0.027) |
179 (0.029) |
181 (0.029) |
|
AR/VR |
28 (0.005) |
42 (0.007) |
48 (0.008) |
48 (0.008) |
58 (0.009) |
50 (0.008) |
Note: Multiply these value in parentheses by 100 to convert them into percentages. Source: Statistics Korea (2024a)
The percentage of manufacturing firms that develop and utilize at least one of the nine automation-related disruptive technologies has steadily increased, from 410 firms (6.7%) in 2017 to 737 firms (11.8%) in 2022. However, adoption rates vary across technologies. Compared with 2017, the number of firms using each technology in 2022 increased by factors of 3.48 for AI, 2.78 for robotics, 2.71 for cloud computing, 1.79 for AR/VR, 1.75 for IoT, 1.72 for big data, 1.36 for 3D printing, 0.83 for blockchain, and 0.71 for 5G.
AI, robotics, and the IoT have been the primary drivers of automation, showing consistent growth from 2017 to 2022. In contrast, the adoption of the remaining technologies has either stagnated or slowed. This slowdown points to different adoption dynamics: for instance, mobile 5G is already widely implemented, which reduces the need for further expansion, and blockchain’s limited relevance in manufacturing contributes to its slower uptake. Meanwhile, AI has recently emerged as a general-purpose technology, triggering a surge in firm-level investment in AI-related innovations.
Despite the growth in AI and robotics adoption, their penetration in the manufacturing sector remains relatively low. By 2022, only 2.7% of manufacturing firms had developed or utilized AI, while 2.9% had done so for robotics. Acemoglu (2024) reports that as of February 2024, approximately 5% of firms in the United States used AI technologies. Similarly, Czarnitzki et al. (2023), analyzing the productivity effects of AI among German firms, found an adoption rate of approximately 7%. However, these figures cover all industries, whereas AI adoption is generally higher in services than in manufacturing. Therefore, the 3% adoption rate among Korean manufacturing firms in 2022 is not significantly lower than global benchmarks. The relatively low AI adoption rates worldwide suggest that AI diffusion is still in its early stages.
In contrast, the share of manufacturing firms that develop and utilize robotics appears low compared to IFR statistics (IFR, 2023). According to the latter, Korea ranks among the top countries in robot density, with approximately 32,000 industrial robots installed annually as of 2022, placing it fourth globally after China, Japan, and the United States (IFR, 2023). The discrepancy between these figures and the Survey of Business Activities results likely stems from differences in statistical methodologies. While the Survey of Business Activities measures robotics development and utilization through firm surveys, the IFR (2023) aggregates annual industrial robot installations by industry. Moreover, survey respondents may have interpreted the questions narrowly, considering only advanced Fourth Industrial Revolution robotics rather than all forms of industrial automation involving robotics.
Tables 2 and 3 present the simple and weighted exposure to AI and robotics of the five industries with the highest adoption rates in 2022. Simple exposure represents the percentage of firms (shown in parentheses) in a given two-digit manufacturing industry classification that have developed or utilized AI and robotics. Weighted exposure, calculated using employment size as a weighting factor, is presented in brackets. An examination of AI’s weighted exposure by industry reveals that in 2022, the electronics and automotive sectors accounted for 46.3% and 41.5% of AI adoption, respectively (Table 2). This suggests that AI adoption is concentrated in large firms, as reported by Bäck et al. (2022) for Finnish firms.
Table 2: Exposure to AI in the Top Five Manufacturing Industries by Number of Respondents (2022)
|
2017 |
2018 |
2019 |
2020 |
2021 |
2022 |
|
|
Electronics, computer, video, audio, and telecommunications equipment manufacturing |
15 (0.022) [0.215] |
31 (0.047) [0.215] |
31 (0.046) [0.506] |
39 (0.059) [0.434] |
39 (0.057) [0.432] |
48 (0.071) [0.463] |
|
Other machinery and equipment manufacturing |
6 (0.008) [0.031] |
10 (0.012) [0.031] |
14 (0.018) [0.047] |
22 (0.028) [0.044] |
30 (0.037) [0.100] |
25 (0.030) [0.092] |
|
Medical, precision, optical, and watch manufacturing |
6 (0.024) [0.112] |
16 (0.059) [0.112] |
17 (0.065) [0.158] |
13 (0.049) [0.111] |
20 (0.072) [0.143] |
20 (0.070) [0.157] |
|
Automobile and trailermanufacturing |
3 (0.004) [0.118] |
5 (0.007) [0.118] |
9 (0.012) [0.385] |
10 (0.014) [0.359] |
11 (0.015) [0.394] |
14 (0.019) [0.415] |
|
Chemicals and chemical products manufacturing |
4 (0.010) [0.087] |
5 (0.011) [0.087] |
7 (0.015) [0.091] |
6 (0.013) [0.079] |
7 (0.016) [0.082] |
9 (0.018) [0.079] |
Note: The figures in parentheses represent simple exposure to AI by industry, while the figures in brackets indicate the employment weighted exposure to AI technology by industry. Multiply these values in parentheses and brackets by 100 to convert them into percentages. Source: Statistics Korea (2024a)
Table 3: Robotics Exposure in the Top Five Manufacturing Industries by Number of Respondents (2022)
|
2017 |
2018 |
2019 |
2020 |
2021 |
2022 |
|
|
Other machinery and equipment manufacturing |
15 (0.020) [0.047] |
32 (0.039) [0.047] |
32 (0.041) [0.067] |
37 (0.047) [0.058] |
39 (0.048) [0.080] |
45 (0.055) [0.068] |
|
Automobile and trailer manufacturing |
16 (0.022) [0.130] |
22 (0.029) [0.130] |
27 (0.036) [0.408] |
29 (0.040) [0.390] |
26 (0.037) [0.459] |
26 (0.036) [0.452] |
|
Electronics, computer, video, audio, and telecommunications equipment manufacturing |
4 (0.006) [0.035] |
13 (0.020) [0.035] |
19 (0.028) [0.343] |
22 (0.033) [0.355] |
24 (0.035) [0.351] |
22 (0.032) [0.448] |
|
Fabricated metal products manufacturing |
2 (0.005) [0.123] |
13 (0.029) [0.123] |
14 (0.032) [0.036] |
13 (0.031) [0.034] |
17 (0.040) [0.052] |
16 (0.038) [0.066] |
|
Electrical equipment manufacturing |
5 (0.014) [0.008] |
5 (0.013) [0.008] |
12 (0.031) [0.085] |
13 (0.035) [0.067] |
13 (0.033) [0.041] |
14 (0.034) [0.114] |
Note: The figures in parentheses represent simple exposure to robotics by industry, while figures in brackets indicate the employment weighted exposure to robotics technology by industry. Multiply these values in parentheses and brackets by 100 to convert them into percentages. Source: Statistics Korea (2024a)
Weighted exposure to robotics technology by industry, presented in Table 3, helps reconcile the discrepancy between the Survey of Business Activities results and IFR (2023) statistics. According to the IFR (2023), the Korean manufacturing industries with the highest annual industrial robot installations in 2022 include the automobile industry, semiconductor/LCD/LED manufacturing, the metal and machinery industry, and other electrical and electronic industries. Similarly, the five manufacturing industries with the highest weighted exposure to robotics based on the Survey of Business Activities are automobile and trailer (45.2%), electronic components, computer, video, audio, and communication equipment manufacturing (44.8%), electrical equipment manufacturing (11.4%), other machinery and equipment manufacturing (6.8%), and metal fabricated products manufacturing (6.6%). These findings indicate that the two sources reflect similar patterns of robotics adoption, with a strong concentration in industries such as automobiles, electronics, and machinery.
In addition, the IFR (2023) highlights regional differences in robot utilization. While the United States and Germany show relatively high adoption in the auto industry, Korea, China, and Japan report higher adoption in the electrical and electronics sectors, as reflected in Table 3. The consistency between IFR (2023) statistics and the Survey of Business Activities reinforces the reliability of observed robotics adoption trends in Korea’s manufacturing sector.
In summary, Tables 2 and 3 indicate that AI and robotics – key automation technologies in Korea – are concentrated in the electronics, electrical, and automobile industries. Adoption is particularly prevalent among large firms, which suggests that major companies such as Samsung Electronics, LG, SK Hynix, Hyundai Motor, and Kia Motors have actively developed and utilized these technologies. These firms leverage automation to enhance productivity, reduce labor costs, mitigate union-related challenges, and improve workplace safety.
3.4.2. Summary Statistics
To analyze the effects of automation technology on employment, we used a balanced panel dataset including only firms consistently observed every year from 2017 to 2022 and excluding those that changed their main business during this period. Table 4 presents the summary statistics for each variable used to estimate the employment effects of automation technologies. The dataset was refined by removing observations that are not log-transformable, contain missing values, represent outliers, or exhibit possible errors.
We further divided the key variables into two groups: firms that have developed and utilized AI or robotics technologies (treatment group) and firms that have not (control group). On average, firms in the treatment group operate at a significantly larger scale than those in the control group. The treatment group has an average of approximately 2.3 thousand employees and 2.7 trillion KRW in real sales, compared to just 300 employees and 300 billion KRW in the control group. This stark contrast suggests that automation adoption, particularly AI and robotics, is concentrated in large firms, in line with broader trends in technology adoption. However, the treatment group also exhibits notably larger standard deviations for key variables than the control group, indicating substantial heterogeneity in firm size. This variation underscores both the significant size differences between the two groups and the wide range of firm sizes in the treatment group.
Table 4: Summary statistics of data used in the employment effect analysis (N = 24,198)
|
Variables |
Variables |
Variables |
||||||
|
Mean |
S.D. |
Min |
Max |
Mean |
S.D. |
Min |
Max |
|
|
Employees (thousands) |
2.3 |
9.8 |
0.1 |
121.4 |
0.3 |
1.7 |
0.1 |
103.0 |
|
AI |
0.521 |
0.500 |
0.000 |
1.000 |
0.000 |
0.000 |
0.000 |
0.000 |
|
Robotics |
0.644 |
0.479 |
0.000 |
1.000 |
0.000 |
0.000 |
0.000 |
0.000 |
|
Export ratio |
0.267 |
0.272 |
0.000 |
1.000 |
0.208 |
0.256 |
0.000 |
4.200 |
|
Real sales (trillions won) |
2.7 |
13.8 |
0.003 |
202.0 |
0.3 |
2.2 |
0.001 |
172.0 |
|
Foreign firm |
0.124 |
0.330 |
0.000 |
1.000 |
0.104 |
0.305 |
0.000 |
1.000 |
|
Chaebol business group |
0.139 |
0.346 |
0.000 |
1.000 |
0.040 |
0.196 |
0.000 |
1.000 |
|
Patents per capita (pcs) |
0.148 |
0.170 |
0.000 |
1.116 |
0.097 |
0.174 |
0.000 |
3.846 |
|
Ratio of regular jobs |
0.973 |
0.064 |
0.450 |
1.000 |
0.981 |
0.064 |
0.030 |
1.000 |
|
Ratio of women employed |
0.195 |
0.156 |
0.000 |
0.899 |
0.228 |
0.178 |
0.000 |
0.969 |
|
Outsourcing |
0.831 |
0.375 |
0.000 |
1.000 |
0.784 |
0.412 |
0.000 |
1.000 |
|
Strategic alliances |
0.245 |
0.431 |
0.000 |
1.000 |
0.067 |
0.251 |
0.000 |
1.000 |
|
Pay-for-performance system |
0.958 |
0.200 |
0.000 |
1.000 |
0.894 |
0.308 |
0.000 |
1.000 |
|
Technology infrastructure |
0.593 |
0.491 |
0.000 |
1.000 |
0.084 |
0.277 |
0.000 |
1.000 |
|
Industry AI exposure |
0.028 |
0.020 |
0.000 |
0.077 |
0.021 |
0.017 |
0.000 |
0.077 |
|
Industry robotics exposure |
0.032 |
0.013 |
0.000 |
0.077 |
0.026 |
0.014 |
0.000 |
0.077 |
Note: Treatment refers to firms that have developed and utilized AI or robotics technology, while Control refers to firms that have not. Source: Statistics Korea (2024a) microdata
In Table 4, the mean value of a dummy variable represents the proportion of firms in that category relative to the total. For example, the mean values for the chaebol business group variable are 0.139 for the treatment group and 0.040 for the control group; this means that 13.9% and 4.0% of firms in the treatment and control groups, respectively, belonged to this category during the analysis period.
Overall, from 2017 to 2022, firms in the treatment group (i.e., developing and utilizing AI and robotics) exhibited higher values across multiple indicators compared to the control group. Specifically, they showed greater employment size, real sales, export rates, foreign ownership, patents per capita, outsourcing, chaebol affiliation, strategic alliances, pay-for-performance systems, AI and robotics-related infrastructure, and industry-level exposure to AI and robotics. In contrast, the control group had a higher proportion of regular jobs and female employment, suggesting a workforce more concentrated in lower-skilled roles. These findings indicate that firms that adopt AI and robotics tend to be larger and more engaged in strategic management practices such as alliances, outsourcing, and competitive compensation systems. They also operate in industries with high investment in automation-related infrastructure, which reinforces their capacity to adopt advanced technologies.
Table 5 presents the summary statistics for the variables used to analyze the wage effects of automation technology over the 2018–2023 period. The average real hourly wage for a manufacturing worker is 75,000 KRW. The average worker age is 44.8 years, highlighting the impact of historically low birth rates and an aging population. Moreover, the average tenure is 8.6 years, suggesting moderate job stability in manufacturing.
We employed several indicators to assess automation exposure at the two-digit manufacturing and three-digit occupational classification levels, lagged for 2017–2022. These include simple industry exposure to AI and robotics from the Survey of Business Activities, the offshorability indicator from Acemoglu and Autor (2011), which measures the likelihood of an occupation being offshored, Frey and Osborne’s (2017) computerization score, which estimates the susceptibility of occupations to automation, and the Webb-AI and Webb-Robot variables from Webb (2020), which capture occupational exposure to AI and robotics based on patent linkages.
Table 5: Summary statistics of data used in the wage effect analysis (N = 162,170)
|
Variables |
Mean |
S.D. |
Mean |
S.D. |
|
Real Hourly Wage (10,000 won) |
7.5 |
4.2 |
0.1 |
232.1 |
|
Industry AI exposure (-1) |
0.021 |
0.018 |
0.000 |
0.077 |
|
Industry robotics exposure (-1) |
0.021 |
0.017 |
0.000 |
0.055 |
|
Offshorability (-1) |
-0.066 |
0.465 |
-2.169 |
1.042 |
|
Computerization score (-1) |
0.687 |
0.066 |
0.380 |
0.804 |
|
Webb-AI (-1) |
0.493 |
0.210 |
0.020 |
1.000 |
|
Webb-Robot (-1) |
0.582 |
0.277 |
0.030 |
0.960 |
|
Age (Years) |
44.8 |
11.8 |
15.0 |
89.0 |
|
Tenure (Years) |
8.6 |
8.8 |
0.3 |
54.0 |
|
Male |
0.710 |
0.454 |
0.000 |
1.000 |
|
Female |
0.290 |
0.454 |
0.000 |
1.000 |
|
High school or below |
0.538 |
0.499 |
0.000 |
1.000 |
|
Associate degree (college) |
0.162 |
0.368 |
0.000 |
1.000 |
|
Bachelor’s degree (university) |
0.252 |
0.434 |
0.000 |
1.000 |
|
Graduate degree |
0.048 |
0.214 |
0.000 |
1.000 |
|
Single |
0.241 |
0.428 |
0.000 |
1.000 |
|
Married |
0.676 |
0.468 |
0.000 |
1.000 |
|
Others |
0.084 |
0.277 |
0.000 |
1.000 |
|
Regular jobs |
0.908 |
0.289 |
0.000 |
1.000 |
|
Temporary workers and others |
0.092 |
0.289 |
0.000 |
1.000 |
|
Managerial and professionals |
0.107 |
0.309 |
0.000 |
1.000 |
|
Clerks |
0.228 |
0.420 |
0.000 |
1.000 |
|
Sales and service workers |
0.023 |
0.150 |
0.000 |
1.000 |
|
Production workers |
0.540 |
0.498 |
0.000 |
1.000 |
|
Elementary occupations |
0.000 |
0.014 |
0.000 |
1.000 |
|
Others |
0.102 |
0.302 |
0.000 |
1.000 |
Source: Statistics Korea (2024b) microdata
The remaining variables in Table 5 are dummy variables, where the mean value represents the proportion of workers in each category relative to the total. For example, in the occupational classification, the mean values for managerial-professional and clerical workers are 0.107 and 0.228, respectively, indicating that 10.7% of workers during the analysis period are classified as managerial-professional, while 22.8% are classified as clerical.
3.5 Estimation Results
3.5.1. Effects on Employment
Tables 6 and 7 present estimates of the employment effects of AI and robotics using various panel estimation models. The dependent variable in Table 6 is log employment size, a level variable, whereas in Table 7, it is the employment growth rate, a rate-of-change variable. This distinction captures how regression coefficient estimates evolve over time in the panel models. As previously discussed, an endogeneity bias may exist between employment (or its growth rate) and automation technology. To address this, we employed instrumental variable estimation, including panel fixed instrumental variable, HTE, and first-difference instrumental variable models. In the panel fixed-effects models, industry-specific dummy variables are excluded from Models 1, 3, 4, and 6 because time-invariant explanatory variables cannot be estimated within a fixed-effects framework.
Table 6: Employment effect of automation technologies: employment level (2017–2022)
|
Dependent variable: log employment |
Model 1 (FE+OLS) |
Model 2 (HTE+EB) |
Model 3 (FE+IV+EB) |
|||
|
AI |
0.033 (0.011) |
*** |
0.048 (0.012) |
*** |
0.046 (0.025) |
* |
|
Robotics |
-0.024 (0.012) |
** |
-0.033 (0.014) |
** |
-0.025 (0.033) |
|
|
Export ratio |
0.019 (0.023) |
0.067 (0.040) |
* |
0.067 (0.014) |
*** |
|
|
Log real sales |
0.265 (0.010) |
*** |
0.298 (0.022) |
*** |
0.242 (0.006) |
*** |
|
Foreign firm |
0.008 (0.012) |
-0.008 (0.018) |
0.001 (0.008) |
|||
|
Chaebol business group |
0.017 (0.026) |
0.044 (0.035) |
0.012 (0.013) |
|||
|
Patents per capita (pcs.) |
-0.846 (0.093) |
*** |
-0.870 (0.128) |
*** |
-0.899 (0.023) |
*** |
|
Ratio of regular jobs |
-0.990 (0.081) |
*** |
-0.732 (0.090) |
*** |
-0.715 (0.027) |
*** |
|
Ratio of women employed |
0.201 (0.046) |
*** |
0.187 (0.068) |
*** |
0.176 (0.027) |
*** |
|
Outsourcing |
0.009 (0.005) |
* |
0.020 (0.013) |
7.5 |
0.020 (0.005) |
*** |
|
Strategic alliances |
-0.002 (0.006) |
0.013 (0.009) |
0.006 (0.004) |
|||
|
Pay-for-performance system |
0.008 (0.007) |
-0.008 (0.017) |
0.021 (0.008) |
** |
||
|
Constant |
3.169 (0.145) |
*** |
2.696 (0.414) |
*** |
– |
|
|
Industry dummy |
No |
Yes |
No |
|||
|
Year dummy |
Yes |
Yes |
Yes |
|||
|
Region dummy |
Yes |
Yes |
Yes |
|||
|
R2 (Within) |
0.267 |
– |
0.277 |
|||
|
Wald χ2 Test |
– |
36,769.5 |
*** |
– |
||
|
Weak instrument test |
– |
– |
12.769 |
|||
|
Overidentification test |
– |
– |
0.087 (p = 0.768) |
|||
|
Observations |
24,198 |
24,198 |
24,198 |
|||
Notes: *, **, *** indicate statistical significance at the 10%, 5%, and 1% levels, respectively. Figures in parentheses represent robust standard errors. OLS = ordinary least squares model; FE = fixed effects model; HTE = Hausman-Taylor model; EB = entropy balancing. The weak instrument test is based on the Kleibergen-Paap rk Wald F-value, while the overidentification test is based on the Hansen J statistic.
Table 7: Employment effect of automation technologies: employment growth (2017–2022)
|
Dependent variable: log employment |
Model 4 (FD+OLS) |
Model 5 (FD+HTE+EB) |
Model 6 (FD+IV+EB) |
|||
|
(AI) |
0.023 (0.010) |
** |
0.019 (0.012) |
* |
0.091 (0.041) |
** |
|
(Robot) |
-0.020 (0.011) |
* |
-0.020 (0.011) |
* |
-0.095 (0.050) |
* |
|
(Export ratio) |
0.013 (0.017) |
0.005 (0.019) |
0.003 (0.029) |
|||
|
(Log real sales) |
0.154 (0.010) |
*** |
0.113 (0.008) |
*** |
0.150 (0.019) |
*** |
|
(Foreign firm) |
0.010 (0.010) |
0.011 (0.010) |
-0.001 (0.014) |
|||
|
(Chaebol business group) |
-0.015 (0.029) |
-0.017 (0.020) |
-0.025 (0.035) |
|||
|
(Patents per capita) |
-1.190 (0.127) |
*** |
-1.340 (0.028) |
*** |
-1.291 (0.188) |
*** |
|
(Ratio of regular jobs) |
-0.852 (0.075) |
*** |
-0.822 (0.032) |
*** |
-0.618 (0.074) |
*** |
|
(Ratio of women employed) |
0.154 (0.039) |
*** |
0.144 (0.029) |
*** |
0.214 (0.081) |
*** |
|
(Outsourcing) |
0.000 (0.005) |
-0.003 (0.005) |
0.006 (0.010) |
|||
|
(Strategic alliances) |
0.002 (0.006) |
0.006 (0.006) |
0.009 (0.009) |
|||
|
(Pay-for-performance system) |
0.005 (0.008) |
0.004 (0.009) |
-0.020 (0.024) |
|||
|
Constant |
-0.029 (0.003) |
*** |
-0.033 (0.008) |
*** |
-0.015 (0.010) |
|
|
Industry dummy |
No |
Yes |
Yes |
|||
|
Year dummy |
Yes |
Yes |
Yes |
|||
|
Region dummy |
Yes |
Yes |
Yes |
|||
|
R2 |
0.240 |
– |
0.230 |
|||
|
Wald χ2 test |
– |
3,874.8 |
*** |
– |
||
|
Weak instrument test |
– |
– |
15.995 |
|||
|
Overidentification test |
– |
– |
1.866 (p = 0.172) |
|||
|
Observations |
20,165 |
20,165 |
20,165 |
|||
Notes: *, **, *** indicate statistical significance at the 10%, 5%, and 1% levels, respectively. Figures in parentheses represent robust standard errors. OLS = ordinary least squares model; FE = fixed effects model; HTE = Hausman-Taylor model; EB = entropy balancing. The weak instrument test is based on the Kleibergen-Paap rk Wald F-value, while the overidentification test is based on the Hansen J statistic.
The dummy variables for AI and robotics development and utilization are likely correlated with firm-specific characteristics that influence employment. However, these characteristics are often unobserved and time invariant in the short run. Unlike fixed-effects models, HTE accounts for both time-invariant variables and differences between firms. This is particularly relevant given that AI and robotics dummy variables show little variation across firms and years, making controlling for firm-level heterogeneity essential. Moreover, several explanatory variables, including qualitative and industry dummy variables, are also time invariant, which reinforces the suitability of HTE. Therefore, Models 2 and 5 are estimated using the HTE approach.
A set of covariates representing firm characteristics may influence firms’ decisions to adopt automation technologies. As indicated by the summary statistics, these covariates differ significantly between firms that adopt AI or robotics (treatment group) and those that do not (control group). To address this imbalance, we applied EB, as shown in Table 8. EB adjusts the covariate distribution of the control group to match that of the treatment group, isolating the net employment effect of automation technology adoption. Table 8 also shows that firms in the treatment group tend to have a larger workforce and are more likely to be classified as chaebol business groups than those in the control group. To mitigate this heterogeneity, we based all model estimates – except for Models 1 and 4, which use ordinary least squares – on weighted regressions. These weights, obtained through EB, ensure that the estimates accurately capture the net employment effect of automation technologies among treated firms.
Table 8: Comparison of covariate distribution between treatment and control groups before and after entropy balancing
|
Variables |
Before EB |
After EB |
|||||||
|
Treatment |
Control |
Control |
|||||||
|
Mean |
Variance |
Skewness |
Mean |
Variance |
Skewness |
Mean |
Variance |
Skewness |
|
|
Export ratio |
0.267 |
0.074 |
0.956 |
0.208 |
0.065 |
1.637 |
0.259 |
0.074 |
1.128 |
|
Log real sales |
12.050 |
3.750 |
1.071 |
11.120 |
1.523 |
1.006 |
11.930 |
3.636 |
1.136 |
|
Foreign firm |
0.124 |
0.109 |
2.283 |
0.104 |
0.093 |
2.602 |
0.120 |
0.106 |
2.333 |
|
Chaebolbusiness group |
0.139 |
0.120 |
2.093 |
0.040 |
0.038 |
4.691 |
0.128 |
0.112 |
2.222 |
|
Patents per capita (pcs) |
0.148 |
0.029 |
1.886 |
0.097 |
0.030 |
5.055 |
0.142 |
0.032 |
2.715 |
|
Ratio of regularjobs |
0.973 |
0.004 |
-3.865 |
0.981 |
0.004 |
-6.468 |
0.974 |
0.004 |
-4.496 |
|
Ratio of women employed |
0.196 |
0.024 |
1.361 |
0.228 |
0.032 |
1.115 |
0.201 |
0.026 |
1.327 |
|
Outsourcing |
0.831 |
0.141 |
-1.767 |
0.784 |
0.169 |
-1.380 |
0.822 |
0.146 |
-1.685 |
|
Strategic alliances |
0.246 |
0.185 |
1.183 |
0.067 |
0.063 |
3.450 |
0.225 |
0.174 |
1.317 |
|
Pay-for-performance system |
0.958 |
0.040 |
-4.587 |
0.894 |
0.095 |
-2.560 |
0.945 |
0.052 |
-3.907 |
Note: Treatment refers to firms that have developed and utilized AI or robotics technology, while control refers to firms that have not.
For Models 3 and 6, which use panel fixed-effects instrumental variable and first-difference instrumental variable estimations, misspecification tests confirm the robustness of the results. The first-stage F-tests for weak instruments reject the null hypothesis, with F-values exceeding the critical threshold of 10 (Staiger & Stock, 1997). Additionally, the Hansen J-test for overidentification does not reject the null hypothesis, confirming the validity of the three selected instrumental variables (industry exposure to AI and robotics and the technology infrastructure dummy variables).
The key explanatory variables in Tables 6 and 7 are the dummy variables for AI and robotics development and utilization. AI is still in its early adoption stages and is predominantly software based, whereas robotics primarily involves hardware-oriented mechanical devices. Although these technologies have distinct characteristics, future advancements in AI-integrated robotics may blur the distinction between them. However, this analysis assumes that AI and robotics remain separate in their automation-related roles and estimates their effects independently. 4
The AI and robotics development and utilization variables, which serve as proxies for broader automation, exhibit statistically significant effects with opposite signs in the ordinary least squares (OLS) estimations (Models 1 and 4). Specifically, AI has a positive effect on employment, suggesting a labor complementarity mechanism that enhances productivity and increases employment. In contrast, robotics has a negative effect on employment, pointing to a labor substitution mechanism. However, these OLS estimates do not account for potential endogeneity bias or heterogeneity between the treatment and control groups. In the remaining models, which incorporate both instrumental variable estimation and EB weighting, AI continues to show a positive employment effect, while robotics retains a negative effect. All models yield significant results, except for Model 3, where the employment effect of robotics is not statistically significant.
Models 2 and 3 indicate that, on average, manufacturing firms that develop or utilize AI experience a 4.8% and 4.6% increase in employment size, respectively, compared to non-adopting firms. Although instrumental variable estimates are often larger than those from other models (Czarnitzki et al., 2023), the estimates in these two models remain similar. Model 2 shows that firms that adopt robotics experience an average 3.3% decline in employment, while Model 3 estimates a 2.5% reduction, though the latter is not statistically significant. In the first-difference Models 4, 5, and 6, the results are only marginally significant at the 10% level. Nonetheless, the effect of AI on employment remains consistently positive and statistically significant across all models. The negative effect of robotics on employment is also statistically significant at the 10% level, though marginal, in all models except Model 3.
These findings differ from existing firm-level studies that report positive employment effects of robotics (e.g., Aghion et al., 2020; Bessen et al., 2020; Koch et al., 2021). However, they are consistent with research by Babina et al. (2024), who found a positive effect of AI on employment at the firm level. In particular, in the HTE model – which applies EB to control for firm-level differences and adjusts for industry-specific characteristics – AI is consistently associated with employment growth, whereas robotics is linked to a decline in employment, regardless of whether the dependent variable is measured as a level or rate of change.
Model 5 shows that AI adoption increases the employment growth rate by approximately 1.9%, while Model 6 estimates a significantly larger 9.1% increase. This disparity raises concerns about potential overestimation in instrumental variable estimates, as noted by Czarnitzki et al. (2023). For robustness, we also estimated employment growth using the HTE approach in Model 5, which yielded results similar to the OLS estimates in Model 4. Robotics adoption is associated with an about 2.0% employment decline in Models 4 and 5. However, in Model 6, the estimated decline is approximately 9.5%, mirroring the large effect observed for AI. This suggests that while Models 4 and 5 provide more moderate estimates, the instrumental variable estimate in Model 6 may be overstated. 5
In models where the dependent variable is measured as a level variable (Models 2 and 3), an additional source of endogeneity bias may arise from the inclusion of the real sales variable. However, identifying a suitable instrumental variable for this poses a significant statistical challenge. For this reason, a first-difference model, in which the dependent variable is measured as the percentage change in employment, is preferred. This model mitigates endogeneity bias by differencing variables, thereby reducing the influence of time-invariant confounding factors. Consistent with this approach, the results in Models 5 and 6 indicate that AI functions as a labor-complementary technology, whereas robotics acts as a labor-substituting technology. Nonetheless, the panel fixed instrumental variables method in Model 6 tends to overestimate coefficients, which should be considered when interpreting the results.
When examining the regression coefficients of control variables other than AI and robotics development and utilization, several variables are statistically significant across all estimated models. An increase in real sales, which serves as a proxy for firm size, is associated with higher employment levels and growth. Furthermore, a higher share of female employment is linked to increased employment levels, which may reflect firms’ efforts to reduce labor costs by hiring women, who tend to earn lower wages due to career interruptions. This trend may also be influenced by the broader increase in female labor force participation. In contrast, employment levels or growth tend to decrease as the number of patents per capita and the proportion of regular jobs increase. A high proportion of regular employees may indicate rigid labor relations in the Korean labor market, which could discourage firms from hiring new workers. The negative relationship between patents per capita, which serves as a proxy for innovation activity, and employment suggests that innovation in Korean manufacturing firms is predominantly labor saving, leading to workforce reductions driven by automation. In Model 3, where the dependent variable is employment level, outsourcing and pay-for-performance systems exhibit a positive effect on employment. The positive effect of outsourcing is consistent with Feenstra and Hanson’s (1996) findings that outsourcing reduces demand for unskilled labor while increasing demand for skilled labor, ultimately resulting in a net positive employment effect. The positive effect of pay-for-performance systems suggests that firms that adopt such compensation structures, in which rewards are tied directly to current performance rather than deferred compensation, tend to be more productive, leading to higher employment levels.
Unlike robotics, AI has a positive effect on employment, likely because adoption is in its early stages and it is recognized as a general-purpose technology with vast potential. As firms increasingly invest in AI to enhance their competitiveness, they generate additional labor demand for emerging occupations such as engineers, programmers, data scientists, and research and development specialists, who are responsible for developing and implementing AI systems (Aghion et al., 2019). Furthermore, employment growth may also result from product innovation driven by AI-related investments (Babina et al., 2024).
In contrast, robotics exhibits a negative employment effect, which deviates from the findings of existing literature. One possible explanation could be related to the strategic objectives behind robot adoption in Korean manufacturing firms. These objectives include improving productivity, preventing workplace accidents, reducing labor costs, and circumventing union influence. Given Korea’s seniority-based wage system, long-term employment stability for regular jobs, strong enterprise unions, and institutional mechanisms protecting regular workers, firms may adopt robots – perhaps even more so to restructure their workforce and avoid union-related constraints – than simply to enhance productivity. According to Acemoglu and Restrepo (2018), the greatest risk to labor comes not from highly transformative, productivity-enhancing technologies but rather from “so-so” technologies – those that firms find worth adopting even though they do not substantially improve productivity. Such technologies incentivize firms to deploy automation primarily for labor substitution. In line with this argument, If Korean manufacturing firms implement robotics – perhaps even more to reduce labor costs than to enhance productivity – they may experience negative effects on employment, leading to workforce contractions.
In this context, an examination of the capital deepening index – measured as the increase in capital stock per worker across major Organisation for Economic Co-operation and Development (OECD) countries (see Figure 1) – reveals that Korea has been an exception. Since the 2010s, the country has pursued labor-saving technological progress that has reduced the relative demand for labor compared to other countries. This trend likely reflects the technocentric approach and the prevalent practice of labor devaluation among Korean manufacturing firms. Globally, declining interest rates and disruptive technological innovations have driven the widespread substitution of labor with capital as the relative price of capital goods has steadily decreased since the 1980s (Karabarbounis & Neiman, 2014). Consequently, the capital deepening index in major OECD countries has experienced a long-term upward trend, although this growth has slowed in the 2020s. Although Korea has also experienced a deceleration in capital deepening, the overall trajectory remains sharply upward. This pronounced rise in Korea’s capital deepening index suggests that its automation strategy is not labor friendly: rather than integrating labor with technology, it relies on capital-intensive automation primarily aimed at replacing human labor.
Another explanation for the negative effects of robotics on employment could be connected to the diminishing marginal benefits of robotization in Korean manufacturing firms. According to IFR (2023) statistics, Korean manufacturing has long been characterized by extensive robot utilization, particularly in the electronics and automotive industries. In this context, the potential employment benefits of robotics-driven productivity improvements may have already been realized, leading to a marginal effect that is either insignificant or currently imperceptible. As implied in Figure 1, despite the rapid expansion of robotics adoption since the late 2010s, the declining marginal benefits of automation appear to have resulted in a labor-substituting effect rather than a labor-complementary effect driven by productivity gains.
Figure 1: Evolution of the Capital Deepening Index for Major OECD Countries (2015 = 100.0)
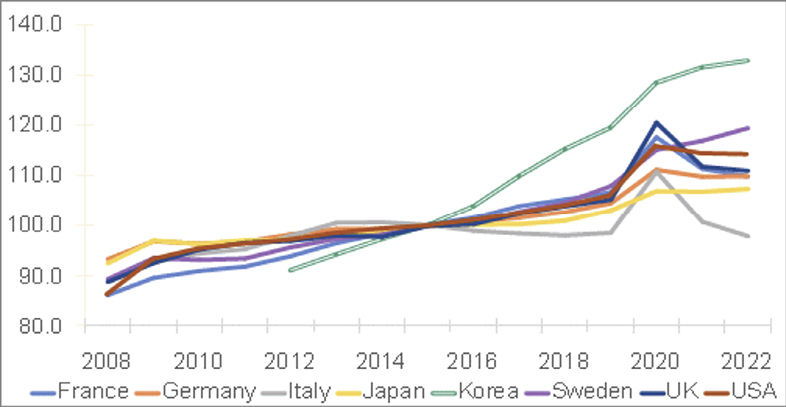
Source: OECD Data Explorer
As highlighted in the descriptive statistics on robot adoption, Korea’s use of robotics has been heavily concentrated in the electronics and automotive industries, which are dominated by large firms. Because large firms dominate robot adoption in these key industries, EB-weighted estimates – despite controlling for industry characteristics and mitigating firm-level heterogeneity by size – may still reflect capture employment effects in large firms. Despite substantial variation in firm size among robotics adopters, early adopters – typically large firms – may have already realized most of the employment effects of automation. As a result, the marginal effects of further automation have diminished over time, suggesting that average effects could remain influenced by outcomes in large firms. From this perspective, our findings do not necessarily contradict the existing literature given that prior studies may not account for the full adoption lifecycle of robotization. Specifically, earlier research may overlook the distinction between the early adoption phase, when robotics generates substantial marginal effects, and the later, mature stage, when automation becomes widespread and its impact diminishes, as seen in Korea.
The last explanation may stem from measurement error. As previously noted, respondents to the Survey of Business Activities may have interpreted the definition of robots too narrowly, thereby limiting the scope of what is captured as automation in the statistics. As a result, the estimation results may primarily reflect employment changes among robot-adopting firms relative to non-robot-adopting firms instead of capturing the broader effects of automation.
Although it remains unclear which explanation plays the dominant role, the first two appear more relevant to Korean manufacturing firms. While measurement error cannot be entirely dismissed, it is an inherent limitation of any survey-based analysis. Furthermore, the effects of automation may vary depending on the level of data aggregation (i.e., macro- and meso-level data, such as country- or industry-level statistics, or micro-level firm data), as discussed earlier.
3.5.2. Effects on Wages
Table 9 presents the pooled OLS estimates of the effects of AI and robotics on wages. Unlike previous estimations of the effects of automation technologies on employment, this analysis relies on cross-sectional labor market data for individual workers in the manufacturing sector rather than a panel dataset of manufacturing firms. The data capture individual labor market outcomes and therefore do not include survey questions or direct measures of automation adoption at the firm level, which are typically linked to firms’ decision-making processes.
Following Szymczak et al. (2022), the estimation in Table 9 integrates meso-level data (e.g., industry- and occupation-level measures of automation technology) with micro-level data on individual worker characteristics to analyze the relationship between automation diffusion and real hourly wages. To address potential endogeneity, we incorporated a one-year time lag at the industry and occupation levels to account for the delayed effects of automation adoption on wages, thereby mitigating potential endogeneity biases. Unlike earlier estimations, which focused on firm-level employment effects, we examine how automation’s spread in an industry influences individual workers’ wages.
Table 9: Wage effects of automation technologies: AI and robotics (2018–2023)
|
Dependent variable: Log real hourly wage |
Model 7 |
Model 8 |
Model 9 |
|||
|
Industry AI exposure (-1) |
0.153 (0.087) |
* |
– |
– |
||
|
Industry robotics exposure (-1) |
-0.268 (0.122) |
** |
– |
– |
||
|
Occupation computerization score (-1) |
– |
-0.229 (0.116) |
* |
– |
||
|
Occupation Webb-AI exposure (-1) |
– |
– |
0.092 (0.053) |
* |
||
|
Occupation Webb-Robotics exposure (-1) |
– |
– |
-0.172 (0.056) |
*** |
||
|
Occupation offshorability |
– |
-0.018 (0.020) |
-0.032 (0.015) |
** |
||
|
Age |
0.027 (0.002) |
*** |
0.026 (0.002) |
*** |
0.025 (0.002) |
*** |
|
Age squared |
-2.93E-04 (2.75E-05) |
*** |
-2.74E-04 (1.83E-05) |
*** |
-2.73E-04 (1.84E-05) |
*** |
|
Tenure |
0.017 (0.001) |
*** |
0.018 (0.002) |
*** |
0.018 (0.002) |
*** |
|
Tenure squared |
-1.28E-05 (3.99E-05) |
-5.66E-05 (4.45E-05) |
-5.35E-05 (4.53E-05) |
|||
|
Male |
0.229 (0.019) |
*** |
0.230 (0.012) |
*** |
0.228 (0.013) |
*** |
|
Associate degree (college) |
0.061 (0.007) |
*** |
0.066 (0.007) |
*** |
0.066 (0.007) |
*** |
|
Bachelor’s degree (university) |
0.138 (0.016) |
*** |
0.146 (0.009) |
*** |
0.144 (0.009) |
*** |
|
Graduate degree |
0.217 (0.023) |
*** |
0.225 (0.015) |
*** |
0.224 (0.015) |
*** |
|
Single |
-0.041 (0.011) |
*** |
-0.034 (0.007) |
*** |
-0.034 (0.006) |
*** |
|
Married |
0.048 (0.010) |
*** |
0.056 (0.007) |
*** |
0.055 (0.006) |
*** |
|
Regular jobs |
0.166 (0.017) |
*** |
0.147 (0.012) |
*** |
0.143 (0.012) |
*** |
|
Managerial and professionals |
0.271 (0.101) |
*** |
0.356 (0.079) |
*** |
0.309 (0.083) |
*** |
|
Clerks |
0.118 (0.096) |
0.252 (0.080) |
*** |
0.185 (0.070) |
** |
|
|
Sales and service workers |
0.052 (0.100) |
0.145 (0.086) |
0.085 (0.076) |
|||
|
Production workers |
-0.022 (0.096) |
0.081 (0.081) |
0.085 (0.081) |
|||
|
Elementary occupations |
-0.132 (0.096) |
-0.008 (0.075) |
0.031 (0.072) |
|||
|
Constant |
0.801 (0.105) |
*** |
0.826 (0.129) |
*** |
0.740 (0.088) |
*** |
|
Year dummy |
YES |
YES |
YES |
|||
|
Industry dummy |
YES |
YES |
YES |
|||
|
R2 |
0.521 |
0.491 |
0.491 |
|||
|
Observations |
162,170 |
162,170 |
162,170 |
|||
Notes: *, **, *** indicate statistical significance at the 10%, 5%, and 1% levels, respectively. Figures in parentheses represent robust standard errors clustered at the 25-industry or 143-occupation level.
Our measure of automation technology is based on industry-level exposure to AI and robotics at the two-digit manufacturing industry classification level, calculated using data from the 2017–2022 Survey of Business Activities. Additionally, we integrated Acemoglu and Autor’s (2011) offshorability indicator, Frey and Osborne’s (2017) computerization score, and Webb’s (2020) AI and robotics exposure indexes at the three-digit occupational classification level. Unlike the other indicators, the computerization score and Webb’s AI and robotics exposure measures rely on standardized occupational classifications matched between the United States and Korea. Consequently, these indicators primarily reflect US labor market dynamics rather than those specific to Korea. Given these, Model 7 uses a simpler measure, namely, industry-level exposure to AI and robotics at the two-digit manufacturing classification level, based on the Survey of Business Activities. In contrast, Models 8 and 9 incorporate the computerization score and Webb indicators, along with the offshorability indicator at the three-digit occupational classification level. As noted earlier, potential endogeneity between automation adoption and wages is mitigated by applying a one-year lag to industry- and occupation-level data.
The control variables for demographic, social, and job characteristics are generally statistically significant and align with expectations. On average, men, older individuals, married workers, and those with higher education, longer tenure, regular employment, or white-collar jobs (e.g., managerial or professional roles) earn higher wages than their counterparts. In addition, the coefficients on age and age squared are positive and negative, respectively, indicating a life-cycle wage pattern in which wages rise with age but at a decreasing rate, in keeping with standard human capital theory.
The results of Model 7 indicate that AI exposure (-1) in an industry has a statistically significant positive effect on wages, with a one percentage point increase in AI exposure in a given year leading to an approximately 0.15% increase in hourly wages in the following year. In contrast, robotics exposure (-1) has a statistically significant negative effect, resulting in an approximately 0.27% decline in hourly wages in the subsequent year. These findings are consistent with the estimations of the effects on employment presented earlier.
Model 8 shows that the occupation-level computerization score (-1) variable has a negative and marginally significant coefficient, suggesting that exposure to automation in some occupations may exert downward pressure on wages, leading to a decline in hourly wages of approximately 0.23% in the following year. The results of Model 9, which incorporates Webb’s occupational AI (-1) and robotics exposure (-1) indexes, are in line with those of Model 7. Specifically, AI exposure is associated with wage increases (of 0.09%), whereas robotics exposure corresponds to wage declines (of 0.17%) in the following year. These findings reinforce the conclusions of Jurkat et al. (2023), whose meta-analysis suggests that the effects of automation on wages tend to be small or close to zero.
Overall, the diffusion of AI at the industry or occupational level tends to increase individual workers’ wages, whereas the spread of robotics has the opposite effect. These findings are consistent with the analysis of effects on employment presented earlier. While AI adoption remains in its early stages, the growing demand for high-skilled workers who can develop and utilize AI appears to drive both employment and wage growth. In contrast, as robotics adoption becomes more widespread, its marginal impact on employment and wages diminishes, ultimately leading to wage declines, which is coherent with previous estimations of effects on employment.
The offshorability variable, which measures the extent to which specific skills can be outsourced to foreign labor markets, has a negative and statistically significant coefficient in Model 9. Although it is not statistically significant in Model 8, it maintains the same sign, indicating that occupations with a high degree of offshorability face downward wage pressure due to the substitution of domestic labor with offshore alternatives.
Notably, despite being estimated using automation indicators that specifically reflect the US labor market, Models 8 and 9 yield results consistent with Model 7, which is based on Korean labor market conditions. This suggests that the economic impact of automation technologies becomes increasingly generalizable due to their broad and universal applicability. While the magnitude and trajectory of automation’s social and economic effects may differ across countries depending on their economic structures and institutional frameworks, the overall direction of these effects appears to be consistent globally.
4 Concluding Remarks
This article examined the impact of two key automation technologies – AI and robotics – on employment in Korean manufacturing firms since the late 2010s. Using data from the Survey of Business Activities, we estimated the effects of AI and robotics on employment and extended them by linking industry-level exposure to automation to individual employment data from the Local Labor Force Survey (National Version) to assess how these technologies influence individual workers’ hourly wages.
The main findings are as follows. First, the development and utilization of AI and robotics in Korean manufacturing firms are highly concentrated in the electronics and automotive industries, which are dominated by large conglomerates. Robotics adoption has been widespread for an extended period, driven by various objectives, including productivity enhancement, labor cost reduction, workplace safety improvement, and union avoidance. As a result, Korea has one of the highest absolute robot stocks and relative robot densities globally. In contrast, AI has only recently emerged as a general-purpose technology, and investment in AI is increasing to enhance competitiveness. However, its development and utilization remain in the early stages, in line with trends observed in other countries.
Second, estimates indicate that AI has a positive impact on job creation, whereas robotics has a negative effect – an outcome that diverges from existing firm-level research. These results reflect the net employment effects of automation, based on estimates that apply EB weights to adjust for observable firm-level differences such as industry characteristics and firm size. However, despite this adjustment, the results may remain influenced by large firms, where robot adoption is concentrated. The negative effects of robotics on employment, which contrast with prior studies, may be explained by several factors. First, manufacturing firms in Korea may adopt robots not only to boost productivity, but also – perhaps even more so – to reduce labor costs, improve workplace safety and circumvent union influence. This reflects the distinctive organizational culture of Korean manufacturing firms, marked by technocratic governance and adversarial labor relations. Second, the marginal effects of long-standing and extensive robotics adoption – particularly in the electronics and automotive industries, where large firms dominate – may have diminished over time. Lastly, measurement error may stem from survey respondents’ potentially narrow interpretation of robotics, leading to results that do not fully capture the broader automation landscape.
Finally, the effects of industry-level exposure to AI and robotics on wages follow the same pattern as the effects on employment, with AI being associated with wage growth and robotics with wage declines. Notably, these results remain consistent even when US-based automation exposure indicators are applied to Korean data, reinforcing the increasingly generalizable impact of automation technologies on employment and wages. Despite variations in institutional and economic structures across countries, the generic and universal applicability of these technologies suggests that their effects extend beyond national contexts.
Considered in conjunction with the TBTC hypothesis, these empirical findings have several theoretical and empirical implications. The TBTC hypothesis suggests that automation can both reduce and enhance employment and wages, depending on its impact on productivity. Consequently, the net effects of automation remain an empirical question, shaped by economic and institutional contexts and the level of analysis. Existing firm-level studies generally find a positive effect of robotics on employment and wages, but evidence from Korean manufacturing firms indicates a negative impact, leading to capital-biased technological change. However, AI adoption appears to have a positive effect, although its full implications remain uncertain given that AI adoption is still in its early stages.
Furthermore, while productivity improvement remains an important motive for robotics adoption, manufacturing firms in Korea may perhaps be driven even more by objectives such as reducing labor costs or circumventing union influence than by pure productivity gains. When automation is pursued primarily with these cost- or control-oriented goals, rather than through genuine productivity-enhancing innovation, it may raise concerns about “so-so automation”, which can suppress employment and wage growth without delivering substantial productivity gains (Acemoglu & Restrepo, 2018). This tendency is particularly evident in the Korean manufacturing sector, where labor markets are shaped by strong employment protections for regular workers and the dominance of enterprise unions, rather than industrial unions.
References
Acemoglu, D. (2024, October 17). America is Sleepwalking into an Economic Storm. New York Times.
Acemoglu, D., & Autor, D. (2011). Skills, Tasks and Technologies: Implications for Employment and Earnings. In O. Ashenfelter and D. Card (Eds.), Handbook of Labor Economics, Vol. 4 (pp. 1043–1171). Elsevier.
Acemoglu, D., & Restrepo, P. (2018). Modeling Automation. American Economic Association Papers and Proceedings, 108, 48–53.
Acemoglu, D. & Restrepo, P. (2019). Automation and New Tasks: How Technology Displaces and Reinstates Labor. Journal of Economic Perspectives, 33(2), 3–30.
Acemoglu, D., & Restrepo, P. (2020). Robots and Jobs: Evidence from US Labor Markets. Journal of Political Economy, 128(6), 2188–2244.
Acemoglu, D., Autor, D., Hazell, J., & Restrepo, P. (2022). Artificial intelligence and jobs: Evidence from online vacancies. Journal of Labor Economics, 40, S293–S340.
Acemoglu, D., Lelarge, C., & Restrepo, P. (2020). Competing with Robots: Firm-level Evidence from France. American Economic Association Papers and Proceedings, 110, 383–388.
Aghion, P., Antonin, C. Bunel, S., & Jaravel, X. (2020). What Are the Labor and Product Market Effects of Automation? New Evidence from France (CEPR Discussion Paper No. DP14443). Center for Economic Policy Research.
Aghion, P., Antonin, C. Bunel, S., & Jaravel, X. (2022). The Effects of Automation on Labor Demand: A Survey of the Recent Literature (CEPR Discussion Paper No. DP16868). Center for Economic Policy Research.
Aghion, P., Jones, B. F., & Jones, C. I. (2019). Artificial intelligence and economic growth. In A. Agrawal, J. Gans, & A. Goldfarb (Eds.). The Economics of Artificial Intelligence: An Agenda (pp. 237–282). University of Chicago Press.
Agrawal, A., Gans, J., & Goldfarb, A. (Eds.). (2019). The Economics of Artificial Intelligence: An Agenda. University of Chicago Press.
Alekseeva, L., Azar, J., Gine, M., Samila, S., & Taska, B. (2021). The demand for AI skills in the labor market. Labor Economics, 71, Article 102002.
Almeida, R. K. (2003). The Effects of Foreign Owned Firms on the Labor Market (IZA Discussion Paper No. 785). Institute for the Study of Labor.
Autor, D. (2014). Polanyi’s paradox and the shape of employment growth (NBER Working Paper No. 20485). National Bureau of Economic Research.
Autor, D. H. (2015). Why Are There Still So Many Jobs? The History and Future of Workplace Automation. Journal of Economic Perspectives, 29(3), 3–30.
Autor, D. H., & Dorn, D. (2013). The Growth of Low-Skill Service Jobs and the Polarization of the US Labor Market. American Economic Review, 103(5), 1553–1597.
Autor, D. H., Levy, F., & Murnane, R. J. (2003). The Skill Content of Recent Technological Change: An Empirical Exploration. Quarterly Journal of Economics, 118(4), 1279–1333.
Autor, D. Katz, L. F., & Krueger, A. B. (1998). Computing Inequality: Have Computers Changed the Labor Market? The Quarterly Journal of Economics, 113(4), 1169–1213.
Aw, B., & Hwang, A. (1995). Productivity and the Export Market: A Firm-level Analysis. Journal of Development Economics, 47, 315–332.
Babina, T., Fedyk, A. He, A., & Hodson, J. (2024). Artificial intelligence, firm growth, and product innovation. Journal of Financial Economics, 151, Article 103745.
Bäck, A., Hajikhani, A., Jäger, A., Schubert, T., & Suominen, A. (2022). Return of the Solow-paradox in AI? AI-adoption and firm productivity (Papers in Innovation Studies No. 2022/1). Lund University.
Banerjee, B., & Jesenko, M. (2016). The Role of Firm Size and Firm Age in Employment Growth: Evidence for Slovenia, 1996‒2013. The European Journal of Comparative Economics, 13(2), 201–221.
Bessen, J., Goos, M., Salomons, A., & van den Berge, W. (2020). Firm-level Automation: Evidence from the Netherlands. American Economic Association Papers and Proceedings, 110, 389–393.
Blau, F., & Kahn, L. (2017). The Gender Wage Gap: Extent, Trends, and Explanations. Journal of Economic Literature, 55(3), 789–865.
Bloom, N., Jones, C. I., Van Reenen, J., & Webb, M. (2020). Are ideas getting harder to find? American Economic Review, 110(4), 1104–1144.
Borghans, L., Weel, B., & Weinberg, B. A. (2014). People skills and the labor-market outcomes of underrepresented groups. Industrial and Labor Relations Review, 67(2), 287-334.
Brynjolfsson, E., & Hitt, L. M. (2003). Computing productivity: firm-level evidence. The Review of Economics and Statistics, 85(4), 793–808.
Brynjolfsson, E., & McAfee, A. (2014). The Second Machine Age: Work, Progress, and Prosperity in a Time of Brilliant Technologies. W.W. Norton & Company.
Cardona, M., Kretschmer, T., & Strobel, T. (2013). ICT and productivity: conclusions from the empirical literature. Information Economics and Policy, 25(3), 109–125.
Cho, J., DeStefano, T., Kim, H., Kim, I., & Paik, J. H. (2023). What’s driving the diffusion of next-generation digital technologies? Technovation, 119, Article 102477.
Czarnitzki, D., Fernández, G. P., & Rammer, C. (2023). Artificial intelligence and firm-level productivity. Journal of Economic Behavior and Organization, 211, 188–205.
Damioli, G., Van Roy, V., & Vertesy, D. (2021). The impact of artificial intelligence on labor productivity. Eurasian Business Review, 11(1), 1–25.
Dauth, W., Findeisen, S., Suedekum, J., & Woessner, N. (2021). The Adjustment of Labor Markets to Robots. Journal of the European Economic Association, 19(6), 3104–3153.
Deming, D., & Kahn, L. B. (2018). Skill requirements across firms and labor markets: Evidence from job postings for professionals. Journal of Labor Economics, 36, S337–S369.
Deming, D. J. (2017). The Growing Importance of Social Skills in the Labor Market. The Quarterly Journal of Economics, 132(4), 1593–1640.
DeStefano, T., Kneller, R., & Timmis, J. (2020). Cloud Computing and Firm Growth (CESifo Working Paper No. 8306). CESifo.
Edin, P.-A., Fredriksson, P., Nybom, M., & Őckert, B. (2017). The Rising Return to Non-Cognitive Skill (IZA Discussion Paper No. 10914). Institute for the Study of Labor.
Emami, A., Welsh, D. H. B., Davari, A., & Rezazadeh, A. (2022). Examining the relationship between strategic alliances and the performance of small entrepreneurial firms in telecommunication. International Entrepreneurship and Management Journal, 18, 637–662.
Eurofound. (2019). Casual Work: Characteristics and Implications. Publications Office of the European Union.
Falk, M., & Koebel, B. M. (2002). Outsourcing, Imports and Labor Demand. Scandinavian Journal of Economics, 104, 567–586.
Feenstra, R. C., & Hanson, G. H. (1996). Globalization, outsourcing, and wage inequality. American Economic Review, 86, 240–245.
Freeman, R. B. (1986). Demand for education. In O. C. Ashenfelter & R. Layard (Eds.), Handbook of Labor Economics, Vol. 1 (pp. 357–386). Elsevier.
Frey, C. B., & Osborne, M. A. (2017). The Future of Employment: How Susceptible Are Jobs to Computerisation? Technological Forecasting and Social Change, 114, 254–280.
Goldfarb, A., Taska, B., & Teodoridis, F. (2020). Could Machine Learning Be a General-Purpose Technology? A Comparison of Emerging Technologies Using Data from Online Job Postings. SSRN Electronic Journal. https://ssrn.com/abstract=3468822.
Gordon, R. J. (2018). Why has economic growth slowed when innovation appears to be accelerating? (NBER Working Paper No. 24554). National Bureau of Economic Research.
Graetz, G., & G. Michaels (2018). Robots at Work. The Review of Economics and Statistics, 100(5), 753–767.
Gries, T., & Naude, W. (2018). Artificial intelligence, jobs, inequality and productivity: Does aggregate demand matter? (MERIT Working Paper No. 2018–047). Maastricht Economic Research Institute on Innovation and Technology.
Growiec, J. (2022). Accelerating Economic Growth: Lessons From 200,000 Years of Technological Progress and Human Development. Springer.
Hainmueller, J. (2012). Entropy balancing for causal effects: a multivariate reweighting method to produce balanced samples in observational studies. Political Analysis, 20(1), 25–46.
Haskel, J., & Westlake, S. (2017). Capitalism Without Capital. The Rise of the Intangible Economy. Princeton University Press.
Hausman, J. A., & Taylor, W. E. (1981). Panel Data and Unobservable Individual Effects. Econometrica, 49(6), 1377–1398.
Hill, M. S. (1979). The Wage Effects of Marital Status and Children. The Journal of Human Resources, 14(4), 579–594.
Humlum, A. (2021). Robot Adoption and Labor Market Dynamics. Working Paper, November 28, Booth School of Business, University of Chicago.
International Federation of Robotics. (2019). World Robotics 2019. IFR.
Josten C., & Lordan G. (2020). Robots at Work: Automatable and Non-automatable Jobs. In K. F. Zimmermann (Ed.), Handbook of Labor, Human Resources and Population Economics (pp. 1–24). Springer.
Jurkat, A., Klump, R., & Schneider, F. (2023). Robots and Wages: A Meta Analysis (Econstor Working Paper). Leibniz Information Centre for Economics.
Karabarbounis, L., & Neiman, B. (2014). The Global Decline of the Labor Share. The Quarterly Journal of Economics, 129(1), 61–103.
Klenert, D., Fernandez-Macias, E., & Anton, J. I. (2023). Do Robots Really Destroy Jobs? Evidence from Europe. Economic and Industrial Democracy, 44(1), 280–316.
Koch, M., Manuylov, I., & Smolka, M. (2021). Robots and Firms. The Economic Journal, 131, 2553–2584.
Krueger, A. B. (1993). How Computers Have Changed the Wage Structure: Evidence from Microdata, 1984–1989. The Quarterly Journal of Economics, 108(1), 33–60.
Lee, K., Kim, J. Y., & Lee, O. L. (2010). Long-term evolution of the firm value and behavior of business groups: Korean chaebols between weak premium, strong discount, and strong premium. Journal of the Japanese and International Economies, 24(3), 412–440.
McMullin, J., & Schonberger, B. (2022). When good balance goes bad: A discussion of common pitfalls when using entropy balancing. Journal of Financial Reporting, 7(1), 167–196.
Mincer, J. (1958). Investment in Human Capital and Personal Income Distribution. Journal of Political Economy, 66(4), 281–302.
Mincer, J. A. (1974). The Human Capital Earnings Function. In NBER (Ed.), Schooling, Experience, and Earnings (pp. 83–96). National Bureau of Economic Research.
Moulton, B. R. (1990). An Illustration of a Pitfall in Estimating the Effects of Aggregate Variables on Micro Units. Review of Economics and Statistics, 72(2), 334–338.
National Academies of Sciences, Engineering, and Medicine. (2017). Information Technology and the U.S. Workforce: Where Are We and Where Do We Go from Here? The National Academies Press.
Nichols, A., & Schaffer, M. (2007). Clustered Standard Errors in Stata. United Kingdom Stata Users’ Group Meetings 2007 07. Stata Users Group.
Noble, D. F. (1984). Forces of Production: A Social History of Industrial Automation. Transaction Publishers.
Romer, P. M. (1990). Endogenous Technological Change. The Journal of Political Economy, 98(5), S71–S102.
Seamans, R., & Raj, M. (2018). AI, labor, productivity and the need for firm-level data (NBER Working Paper No. 24239). National Bureau of Economic Research.
Solow, R. M. (1957). Technical Change and the Aggregate Production Function. The Review of Economics and Statistics, 39(3), 312–320.
Staiger, D., & Stock, J. H. (1997). Instrumental variables regression with weak instruments. Econometrica, 65, 557–586.
Statistics Korea. (2024a). Survey of Business Activities. Statistics Korea.
Statistics Korea. (2024b). Local Labor Force Survey (National Version). Statistics Korea.
Szymczak, S., Parteka, A., & Wolszczak-Derlacz, J. (2022). Position in global value chains and wages in Central and Eastern European countries. European Journal of Industrial Relations, 28(2), 211–230.
Tam, S., & Xu, X. C. (2024). Advancing Labor Market Reforms in Korea (Working Paper No. 24/183). International Monetary Fund.
van Herpen, M., Cools, K., & van Praag, M. (2004). Wage Structure and the Incentive Effect of Promotions (Tinbergen Institute Discussion Paper No. 04-107/3). Tinbergen Institute.
Webb. M. (2020). The Impact of Artificial Intelligence on the Labor Market. Working Paper, January, 11, Department of Economics, Stanford University.
Weinberger, C. J. (2014). The increasing complementarity between cognitive and social skills. Review of Economics and Statistics, 96(4), 849–861.
Date received: January 2025
Date accepted: April 2025
1 This article limits the analysis to the 2-digit classification level of manufacturing industry, as industry variables in the Survey of Business Activities are disclosed only at this level. In contrast, the Local Labor Force Survey (National Version) provides occupation variables at a more granular level, down to the 3-digit classification level.
2 The EB procedure utilizes a set of covariates from the estimation equation to generate weights. The weighting process stops once an equilibrium condition is met, ensuring that the three moments of the covariate distributions (mean, standard deviation, and skewness) are balanced between the treatment and weighted control groups. Moreover, unlike studies that rely on single-year cross-sectional data, the dataset used in this study consists of multi-year panel data. To account for this, we treat the multi-year panel data as a single dataset and apply EB weighting accordingly. However, this approach has limitations, as discussed by McMullin and Schonberger (2022). Nonetheless, the application of EB to multi-year panel data provides a robust method for reducing covariate imbalance while preserving the longitudinal structure of the dataset.
3 However, due to confidentiality concerns, some data from the Survey of Business Activities are not publicly available, particularly for industries with a small number of firms. To address this limitation, we used the aggregate results published by Statistics Korea because they incorporate the full dataset and provide a comprehensive view of technology adoption trends.
4 The correlation between AI and robotics adoption is approximately 0.26, indicating that multicollinearity is unlikely to be a concern.
5 The standard errors, particularly in Models 6, are larger than those in the other models, possibly due to the lack of a more suitable instrumental variable than the one used in the first-difference model (see Czarnitzki et al., 2023). The HTE estimates (Model 5) can yield reasonable results, particularly in line with those of Model 2.