
Potentials and Limitations of Active Learning
For the Reduction of Energy Consumption During Model Training
1 Introduction
In their seminal paper on sustainable AI, Strubell et al. (2019) found that training a single machine learning model (including neural architecture search) emits the same amount of carbon as five cars across their entire lifetime. The study not only attracted the attention of scholars but also found its way into general-interest magazines outside of the machine learning community.1 Within the research field, Strubell et al. (2019) triggered a discussion on sustainable AI that addresses how carbon emissions from machine learning can best be not only documented but also reduced. The current research on machine learning has been criticized for focusing exclusively on ever-larger models and data sets. Applying methods designed to reduce the size of either is necessary to keep AI’s carbon footprint low. This article tests the potentials and limitations of Active Learning (AL) (Settles, 2009) as a way of decreasing the training data size while keeping model performance stable.
AL is a method of sampling high-quality data for annotation by querying a pool of unlabeled data. This results in smaller labeled data sets but keeps the model performance close to what it would have been with a larger data set. Most research on AL is motivated by keeping the time and monetary costs of data annotation low. However, in the context of sustainable AI, AL can have other advantages. Smaller data sets are sustainable in at least two senses of the term. There is the ecological side – smaller data sets shorten model training and thereby reduce carbon emissions, assuming that the hardware and energy mix remains the same. However, there is also a social side: Smaller data sets enhance accessibility because they are easier for low-resource AI projects to create and reuse. However, there are computational overheads attached to AL itself. This means that while the consequent reduction in data is beneficial for ecological sustainability and inclusive research on machine learning, it is not clear whether the process of AL is costed appropriately. This requires testing.
The core of this article is a case study of AL with a focus on sustainability. AL has been proposed as a method for reducing AI’s carbon footprint (Treviso et al., 2022), and it has been subject to intensive research (Settles, 2009; Ren et al., 2021). However, there is no empirical research on its potential to reduce carbon emissions. This article intends to fill that gap. Two core questions will be addressed:
1) How efficient is AL in comparison to typical data sampling methods?
2) How can we optimize AL’s efficiency?
Efficiency is understood as a trade-off between performance (often measured using performance scores such as F1 , Accuracy, and BLEU) and computational cost (as an indicator for a model’s energy consumption). In other words, this article focuses on how we can use AL to achieve high model scores while keeping the computational efforts low and using as little energy as possible.
The case study employs popular data sets widely used for text classification. The panel comprises data sets of different sizes and different numbers of class labels. Therefore, this study’s results give a good indication of AL’s potential in the field of text classification and for similar task types. The article makes several key contributions. First, it compares AL and typical data sampling strategies in the context of a broad variety of data sets and in terms of carbon emissions for data collection and model training. Second, it conducts experiments on different parameter settings for AL with a focus on efficiency, that is, the influence of parameter choices on model performance and computational costs.
The paper is structured as follows. First, it discusses recent research on AI’s carbon footprint, with an emphasis on AL. The method is introduced and experimental results are presented. Two main parameters for making AL more efficient are identified: reducing the data queried and decreasing the number of query rounds. After discussing the efficiency gains associated with the two options, the article ends with a section on limitations and recommendations.2
2 Background
2.1 Conceptual Work on Sustainable AI
Since Strubell et al. (2019) published their seminal paper, considerable research on sustainable AI has appeared. To begin with, conceptual work arrived to name the problem. One famous exemplar is van Wynsberghe (2021), who distinguishes between AI for sustainability and sustainable AI. The first denotes AI or machine learning applications that foster sustainability by, for example, making renewable energy sources more efficient or aiming at sustainable development goals more generally. The latter aims at making AI itself sustainable by keeping its carbon footprint low. Schwartz et al. (2020) coined the term Green AI in contrast to Red AI, with the latter aiming at better performance in the sense of higher accuracy, better F1 , or some other common metric and the former considering not only common performance metrics but also efficiency, understood as a tradeoff between performance and computational cost. Finally, Kaack et al. (2022) introduce an ample taxonomy that captures AI’s impact on sustainability at three levels: computing-related impacts, immediate application impacts, and system-level impacts. In the following, I will refer to the issue as sustainable AI but keep in mind the potential for subtle differences between the different notions.
2.2 Emission Reductions at Different Stages of the AI Lifecycle
Substantial research has concerned itself with reducing AI’s carbon footprint, much of it dedicated to model compression techniques. This is no surprise – these methods not only foster sustainable AI but can also deploy large machine-learning models on mobile devices, which adds an economic incentive. The most popular example of model compression is quantization. Quantization aims to reduce the precision of data types used for machine learning. Full precision (float32) is the standard. Using half precision (float16) instead is already promising to halve the model’s computational costs. An even more aggressive approach to quantization reduces precision down to the integer level (Dettmers et al., 2022; Dettmers & Zettlemoyer, 2023).
Recent surveys (Menghani, 2021; Xu et al., 2021; Treviso et al., 2022) categorize emission reduction techniques broadly into efficient data usage, efficient model design, efficient training, and efficient inference. Quantization is an example of efficient inference, as are pruning and distillation (Sanh et al., 2020). Low-rank approximation is mentioned for model design and parameter-efficient fine tuning (Hu et al., 2021; Dettmers et al., 2023) or workload scheduling (Wiesner et al., 2021) for training. Treviso et al. (2022) mention AL as a promising method for decreasing the size of training data, which decreases training time and, thereby, energy consumption and carbon emissions. However, no extant study provides insight into AL’s potential for efficient data usage and model training. This article aims to fill the gap.
By focusing on AL, this article tests emissions reduction techniques during the training phase. Most research on model emissions focuses on the training phase of a machine-learning model. However, as Luccioni et al. (2022) report, about 22 % of the emissions for BLOOM were dedicated to hardware manufacturing. According to Wu et al. (2021), at Meta, electricity consumption related to machine learning workloads is divided between 31 % for data processing, 29 % for training (including experimentation), and 40 % for inference. Similar numbers for inference are recorded by Google, who report that 60 % of their electricity usage for machine learning is dedicated to it.3 Elsewhere, Nvidia’s CEO is quoted as saying that 80 to 90 % of their monetary costs are spent on inference.4 One can reasonably assume that this is correlated with electricity consumption. In sum, recent research suggests that inference is the main cause of CO2 emissions during the AI lifecycle. Nonetheless, it requires adjustment at all stages, and AL is one candidate for the training phase.
2.3 Alternative Approaches to Data Quality
AL is one of many techniques designed to enhance machine-learning data quality. Data quality and data-centric AI 5 have received increased interest in recent years. Often, high-quality data has a stronger impact on model performance than model-centric methods like hyperparameter tuning. Recently, Mitchell et al. (2022) published a comprehensive survey concerning measuring data quality. Another notable line of research is Confident Learning, a technique designed to remove label noise from a given data set (Northcutt et al., 2022). While making data sets sustainable in the sense that these methods enable better reuse, they do not necessarily increase the ecological sustainability of data sets. By contrast, data minimalism (Regneri et al., 2019) has a direct environmental impact. This line of research tries to put a (monetary) price tag on individual data points. Although it does not aim directly at environmental sustainability, it is highly aligned with the project.
The data quality research strand most similar to AL is called data set distillation or data set pruning (Yu et al., 2023).6 As in the case of AL, the aim is to reduce the size of the data set. In the case of pruning, this is achieved by selecting a subset of the original data set; in the case of distillation, a small synthetic data set carries as much information as the original is created. Data set distillation was introduced by Wang et al. (2020), who managed to create ten synthetic images from the MNIST data set, with which they achieved an accuracy of 93.76 % (compared to 99% when trained on all 60,000 images). Sorscher et al. (2023) used pruning to discard 20 % of ImageNet while keeping the model performance constant. They mention that a key advantage of pruning over AL is that it is a one-shot selection and does not proceed across multiple rounds. This is beneficial in terms of computational efficiency.
Keeping data sets small reduces the emissions associated with model training (assuming the hardware and electricity mix stays constant). Therefore, applying methods to reduce data set size while keeping model performance constant is one path to sustainable AI. The following section more comprehensively introduces AL and its potential to create data for more efficient training.
2.4 Active Learning for Sustainable AI
Active Learning Explained
An early description characterizes AL as follows: “The key hypothesis is that if the learning algorithm is allowed to choose the data from which it learns – to be ‘curious,’ if you will – it will perform better with less training” (Settles, 2009). From a technical perspective, the key benefit in this description is the improved performance. From a sustainability perspective, however, the decrease in training time is equally important because less training means lower computational costs, which often directly translates into decreased carbon emissions. However, it is also beneficial in terms of monetary and human resources. With AL, only the most informative data points are chosen for annotation, which keeps costs low. Therefore, AL can also be viewed as an enabler of low-resource AI projects.
AL stands in contrast to the more traditional or typical approach to annotation projects. The following abbreviates this approach as TL, representing typical or traditional learning.7 For TL, a data sample is chosen and annotated without regard for a(n) (ensemble of) machine model or algorithm. By contrast, AL proceeds in rounds. There are several approaches to AL (Settles, 2009). Most notable are Pool-based AL and Stream-based AL. For the latter, single unlabeled examples are sequentially sampled. In each round, the example is chosen or discarded according to a query strategy (explained in the next paragraph). If the example is chosen, it is labeled by what is often called the Oracle. In real-world settings, the Oracle is usually one or multiple human annotators. In our setting, the labels are taken from existing data sets. After each round, the model is re-trained on the former data set and the additional example that was just queried. Pool-based AL is similar. As in the case of Stream-based AL, it is assumed that there is access to a large quantity of unlabeled data. This is called the Pool (see Figure 1. Each round, the model is trained on the training set and then the Pool is queried. According to the query strategy, n examples are sampled and labeled. This is repeated until reaching a desired performance or data set size. The key difference to Stream-based AL is that Pool-based AL sees the entire unlabeled data set queried at once. This increases the computational costs but also the chance of finding the most informative examples. This article will only consider Pool-based AL (henceforth, AL). The limitations section discusses differences from Stream-based AL.
Figure 1: Active Learning setup
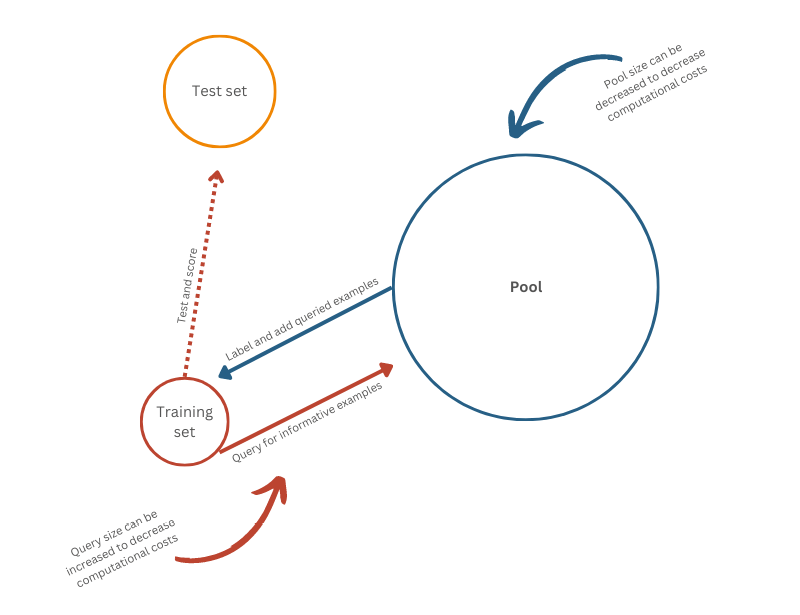
Note. Each round, a model is trained on the training set and then used to query the Pool. According to a query strategy, n examples are sampled, labeled, and added to the training set. This repeats until meeting a certain stopping criterion, for example, a predefined data set size. To evaluate the model each round, it is tested on a test set.
The most common query strategy is uncertainty sampling, which employs different techniques to sample examples that the model is most uncertain about. For classification tasks, uncertainty is often measured as small differences within the distribution of predicted probabilities. This article’s focus is uncertainty sampling. The next section introduces two uncertainty sampling methods are introduced. For the mathematical details, see Appendix A.
One disadvantage of uncertainty sampling is that it likely leads to a sampling bias. Focusing on uncertainty means that examples close to the decision boundary are selected rather than examples that are representative of the underlying distribution (Dasgupta, 2011). Diversity sampling avoids this problem. One possible approach is to compute clusters in the feature space to acquire a diverse sample (Bodó et al., 2011). However, pure diversity sampling risks sampling examples with low uncertainty, that is, examples that are easy to classify. Hybrid versions try to combine diversity and uncertainty strategies by sampling the most uncertain examples but with a special regard for keeping the sample representative of the underlying distribution (Yuan et al., 2020, Margatina et al., 2021).
2.5 Research Questions
AL’s effectiveness has been demonstrated multiple times. Several studies find that AL leverages only a small percentage of the original data set and achieves almost the same performance. Schröder et al. (2022) test several query strategies on multiple data sets using transformer models. For accuracy of only 1 – 3 % below the original scores, they require 0.4 %, 0.5 %, 5.8 %, 9.6 %, and 15.5 % of the original data set size for five different data sets. Yuan et al. (2020) produce similar results, achieving almost the original performance with only about 1,000 out of 180,000, 110,000, 60,000, or 17,500 examples. The same is shown by Margatina et al. (2021). This demonstrates the massive potential of AL for efficient machine learning.8 However, it is not clear whether AL is also superior to TL in terms of efficiency. This leads to the first of this study’s two overarching questions:
RQ1: How efficient is AL in contrast to TL?
Efficiency is understood as a tradeoff between model performance and computational costs (and, thereby, emissions) in training the model. Ideally, AL leads to an increase in performance while reducing the computational workload for training the model. Comparing the efficiency of AL to TL requires two baselines: the performance on the full data set (full baseline) and the performance on a random sample for each query round (random baseline). The evaluation against the full baseline addresses how AL improves or diminishes the performance and emissions in contrast to training on a large data set. A full baseline is only available under laboratory conditions because it requires a large, labeled data set. In many real-world scenarios, where the size of the data set is limited by time and financial constraints, AL is applied because there are no resources for building a large, annotated data set. The evaluation against the random baseline is more relevant to these scenarios, answering the question of whether the increase or decrease in performance is due to the AL query strategy or whether the model just requires less data. In other words, in scenarios where the size of the data set is fixed, it answers the question of whether AL leads to a better data set of this size or whether a random sample is just as good or even better.
However, even if AL turns out to improve the model performance, it might still be the case that AL is inferior to TL in terms of computational costs and carbon emissions. For AL, the Pool is queried and the model is trained multiple times. Depending on the Pool and step size, this is likely to require more time than simply training the model once on the entire Pool. Furthermore, if the hardware and electricity mix remain the same, longer training time directly translates to higher CO2 emissions. Therefore, in scenarios where AL has a higher carbon footprint than TL, we arrive at our second research question:
RQ2: How can the efficiency of AL be increased?
The AL process features two parameters that can be tweaked to make it more efficient: Pool size and step size. Querying a larger Pool requires more time than querying a smaller Pool. Therefore, decreasing the Pool size decreases emissions. For large Pool sizes, that is, scenarios in which most emissions result from querying the Pool and only a small portion is dedicated to training the model, we can assume that the percentage by which the Pool is shrunk roughly equals the percentage of emissions saved. For smaller Pool sizes, the effect is smaller. However, one risk of reducing the Pool size is the problem of limited choices. A larger Pool increases the chance of finding the most informative examples, with a smaller Pool limiting the choices for each query and, thereby, the chances of finding the most informative examples.
The second option is to increase the step size, which means increasing the number of examples queried each round. Querying more examples each round requires fewer rounds and, thereby, less time to obtain the desired data set size. However, this also encompasses a risk: Assuming that similar examples produce similar prediction probabilities, it is highly probable that a single query is highly homogenous. Increasing the step size invites the danger of increasing the homogeneity of the final data set. The next section presents the results of AL on multiple data sets but also with varying Pool size or step size.
Scope of AL
AL’s potential to reduce training emissions depends on its number of application areas and whether its computational costs are amortized in the long run. That is, it depends on the share of supervised learning in machine learning overall and on the frequent reuse of data sets. To the best of my knowledge, for neither factor are there representative numbers that are valid for research, economy, and civil society projects alike. However, certain data sources at least provide limited insight into these factors.
Although AL is mostly used in supervised learning and not in unsupervised or self-supervised settings, exceptions exist. For example, AL has been applied to Few-Shot Learning (Diao et al., 2023), but the small size of the data sets in this setting means that AL is unlikely to significantly decrease training emissions. Estimating the share of supervised learning in machine learning overall is no trivial task. One option is to consider the task types that are most common at Hugging Face, a popular platform for data sets. In fact, supervised learning – in the shape of, for example, text, token, or image classification – plays a major role (Appendix D). Nonetheless, Hugging Face is not representative of the entire machine learning community, and the numbers could differ between research and business applications. However, given that supervised learning likely remains the most efficient way to tackle highly specific and custom problems with machine learning (Luccioni and Rogers, 2023), it can be assumed that AL enjoys a wide range of application areas.
The second factor that determines the scope of the present results is how frequently data sets are reused. Even if AL turns out to be less efficient for a single training run, the computational costs might amortize if the smaller data set is used repeatedly in subsequent training runs. Regarding the share of supervised learning, it is difficult to make general statements about how often data sets are reused. I accessed the download numbers of two of the most common platforms for data sets: Kaggle9 and Hugging Face.10 Kaggle hosts over 200,000 data sets and Hugging Face over 25,000. On Kaggle, a data set is downloaded 6,200 times on average (median = 1,057); on Hugging Face, the average is 13,356 times (median = 1,211). This means that if we reduce the data set size by a large share, this efficiency increase often pays off thousands of times. However, data sets on both platforms are mostly used for educational purposes, which means that these findings do not represent the general reuse of data sets. However, especially for time-dependent settings in which a model needs regular re-training on a continuously updated data set, it is likely that the reuse factor is high and AL could prove beneficial for efficiency.
3 Method
All experiments are performed on our own server with a single Tesla V100S-PCIE-32GB and 32 AMD EPYC 7302P 16-Core Processors. Electricity usage is documented using the CodeCarbon library11 from Lottick et al. (2019). Instead of using their estimated emission rate for Germany, 485 gCO2/kWh is used, a number documented for 2021 in a publication by the German Federal Environment Agency (Icha et al., 2022).
For the experiments, the scope is limited to text classification using a pre-trained transformer. To avoid using only English language data sets, some German language data sets are added and a multilingual transformer (XLM-Roberta base)12 is used. The model is trained for three epochs using the default hyperparameters. The data sets are chosen to represent a broad variety of size and class numbers. For an overview, see Table 1.
Table 1: Data sets used for the AL experiments
|
Data set |
Size (rows) |
Labels |
Language |
Source |
|
Claim Detection |
4,188 |
2 |
DEU |
Risch et al. (2021) |
|
Cola |
9,569 |
2 |
ENG |
Warstadt et al. (2019) |
|
News Topic |
10,273 |
9 |
DEU |
|
|
Liar |
12,836 |
6 |
ENG |
Wang (2017) |
|
Medical Abstracts |
14,438 |
5 |
DEU |
Schopf et al. (2022) |
|
GoEmotions |
15,237 |
10 |
ENG |
Demszky et al. (2020) |
|
Claimbuster |
23,533 |
3 |
ENG |
Arslan et al. (2020) |
|
imdb |
50,000 |
2 |
ENG |
Maas et al. (2011) |
|
Patient Reviews |
52,751 |
6 |
DEU |
|
|
Yahoo |
110,000 |
10 |
ENG |
Zhang and LeCun (2016) |
|
AG News |
127,600 |
4 |
ENG |
Zhang and LeCun (2016) |
|
Twitter Sentiment |
211,983 |
2 |
ENG |
Naji (2012) |
Some of the data sets – for example, AG News or Yahoo (Yuan et al., 2020; Schröder et al., 2022) – have been used for other studies on AL. For some data sets, such as Claimbuster, there is no previous work on AL. The data set sizes range from about 4,200 to more than 200,000 sentences. The number of labels varies between two and ten. Claimbuster, Liar, and Claim Detection are used for the assistance of fact-checkers and to address disinformation. News Topic, AG News, Medical Abstracts, and Yahoo are data sets for the topic classification of newspaper articles, abstracts, and Yahoo posts. Twitter Sentiment, Go Emotion, imdb, and Patient Reviews correspond to sentiment or emotion classification. Cola is a data set capturing grammatical acceptability of sentences.
To perform AL, two query strategies are chosen: Breaking Ties and Prediction Entropy. The Breaking Ties strategy considers the difference in prediction probabilities between the first and second most likely class. A low difference indicates that the model features a high level of uncertainty. However, Breaking Ties only considers the two most likely classes. This can be a disadvantage in multiclass settings. Meanwhile, Prediction Entropy is high when the prediction distribution is close to uniform, which again indicates a high level of uncertainty. In sum, for Breaking Ties, I sample the n examples with the lowest difference between the two most likely classes, and for Prediction Entropy, I sample the n examples with the highest entropy. n refers to the step size. For more details regarding the two query strategies, see Appendix A.
Each data set is split into a Pool set (70 %) and a test set (30 %). The initial training set size is always 1% of the Pool size. The Pool is queried until reaching a desired data set size. For most data sets, this is 10 % of the Pool size. Due to time constraints, for larger data sets, the process is stopped at 7 %, 5 %, or 3 %. To illustrate: AL for Twitter Sentiment took 41 hours to reach 3 % of the Pool size. The first round of experiments is conducted with a step size of 50 and the full Pool size. Subsequent rounds of experiments are only performed on a sub-sample of the data sets. This subsample comprises News Topic, Claimbuster, and AG News. These data sets vary by size and number of labels, with models coming close to the full baseline and often outperforming the random baseline. Step sizes of 100 and 250 are tested (with Pool size 100 % and Pool sizes of 70 % and 50 % are tested with step size 50.
Findings
The results of the different experiments appear in Figures 2, 3, and 4 and the exact numbers in Appendix B and Appendix C. Figure 2 illustrates the results for three of the twelve data sets and relates them to the two baselines. Overall, AL leads to a good performance, with the F1 close to the full baseline. However, AL emits more CO2 than the full baseline. The plot shows the results for step size 50 and Pool size 100 %. Each bar represents the best performance (top), that is, the emissions that achieve this performance (bottom). As the bars demonstrate, AL and the random baseline require only a small fraction of the original training set to achieve an F1 close to the full baseline, which uses 100 % of the training set.
Of the two query strategies, Breaking Ties performs better. For AG News and Claimbuster, the results are satisfactory, with AL outperforming the random baseline and coming close to the full baseline for both. For News Topic, the results are less promising, with Breaking Ties performing 0.08 worse than the full baseline and only 0.01 better than the random baseline. This can be explained by the fact that News Topic is the smallest of the three data sets but features the most classes. For the two larger data sets, Claimbuster and AG News, the full baseline emitted less carbon than querying multiple rounds with either AL or random sampling. Only in the case of NewsTopic did random sampling record a smaller carbon footprint than the full baseline. However, in this case, too, AL demanded heavier computation than training once on the full training set.
Figure 2: Results for Active Learning on three data sets
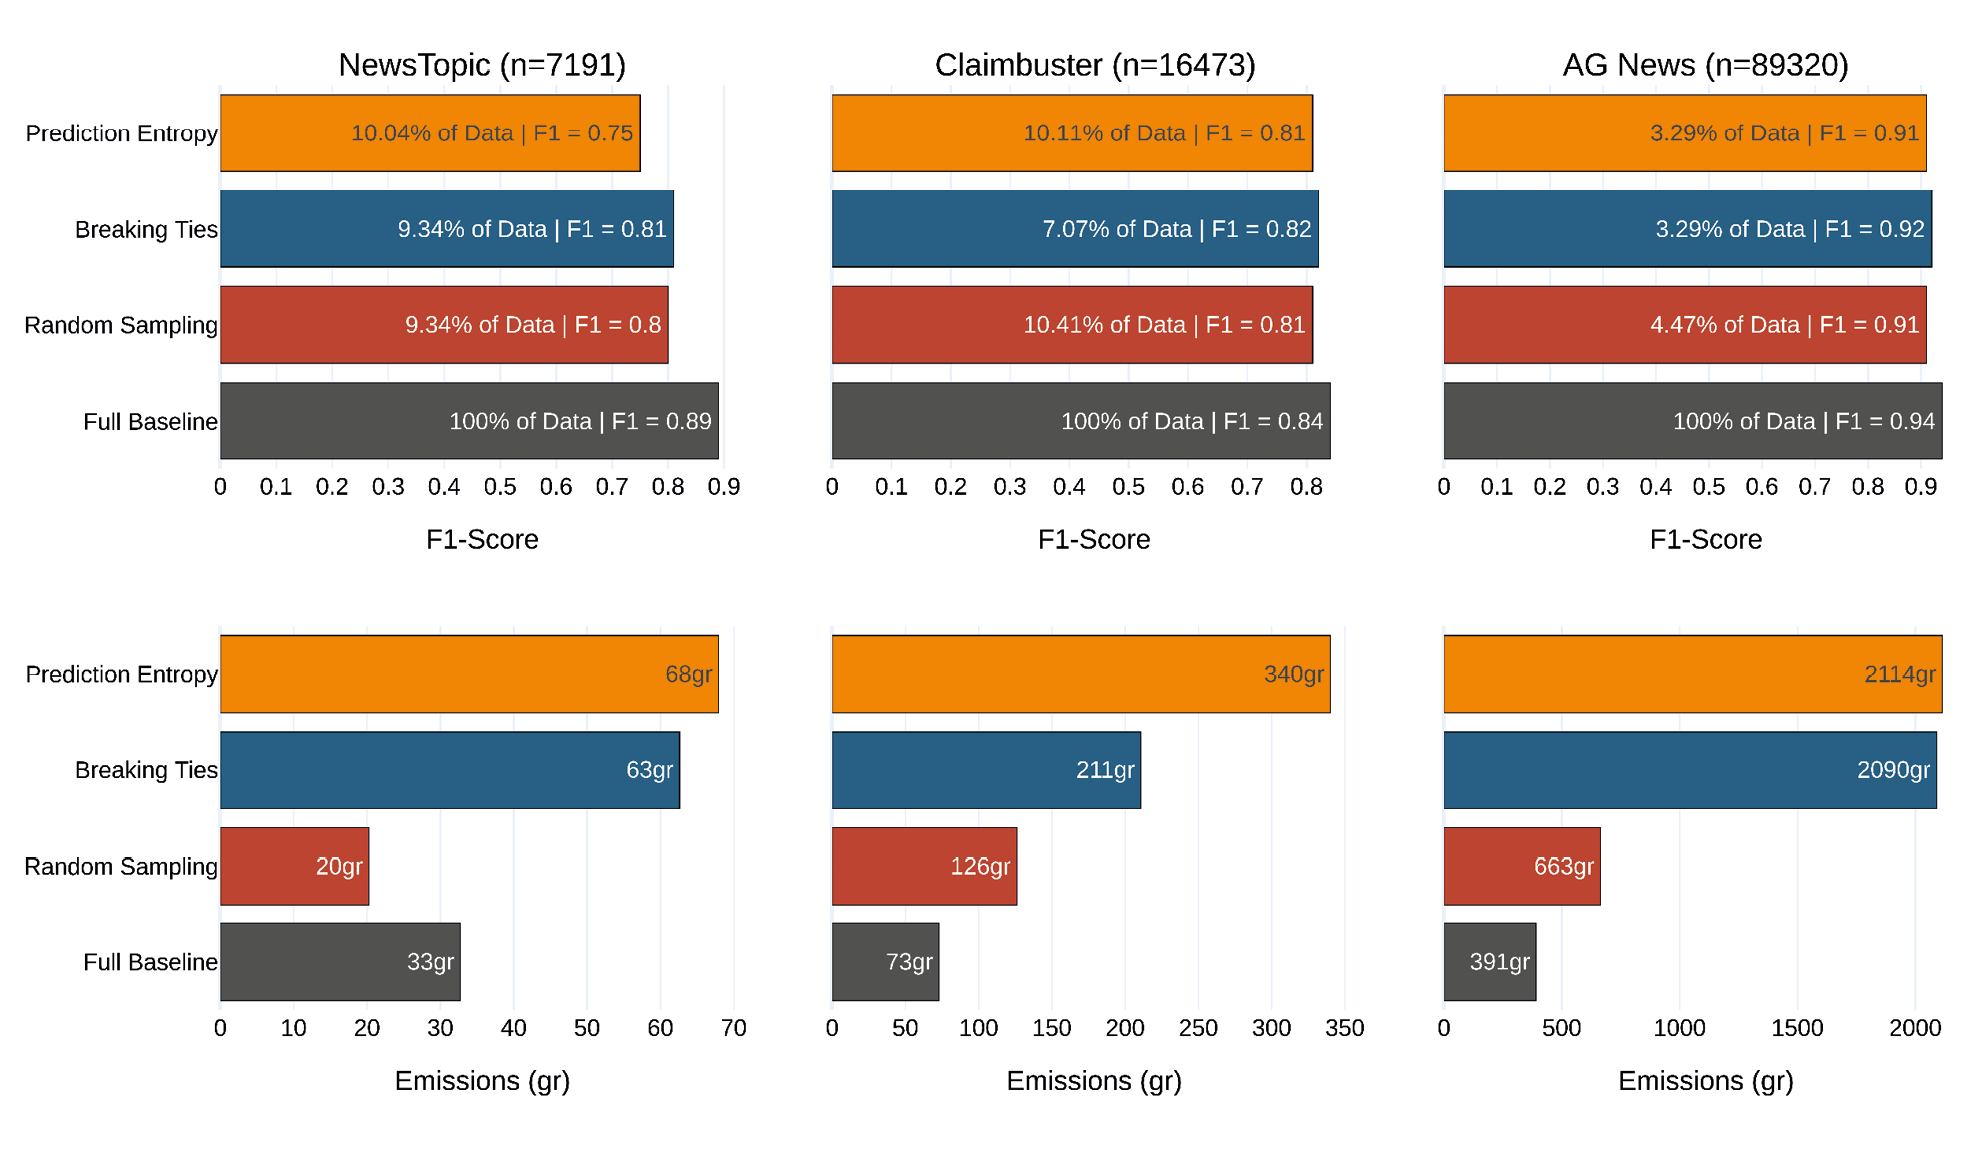
Note. The y axes represent the AL query technique (i.e., the random and full baseline). The x axes represent the F1 (top) and the CO2 emissions for training and querying (bottom).
Figure 3 represents the results for all data sets. As before, AL comes close to the full baseline or even exceeds it. Only for a few data sets is the performance significantly worse than the full baseline. However, here, too, emissions for AL are higher than for the full baseline, an effect that increases with Pool size. The exact numbers of all experiments appear in Appendix B.
The first plot represents the (best) performance on each data set compared to the full baseline. The general performance trend is satisfactory. Assuming that a small reduction of about 4 % in performance when compared to the full baseline remains good, AL fulfills its purpose for most data sets. The substantial increase for Liar and Medical Abstracts is explained by the weak full baseline, with models trained on the full Liar training set only reaching an F1 of 0.07. In most cases, the Breaking Ties strategy outperforms the Prediction Entropy strategy. This is especially surprising for multilabel data sets, such as News Topic and Yahoo, because Breaking Ties only considers the two most likely classes.
The second plot illustrates the performance of AL in contrast to the random baseline. With only one exception (Patient Reviews) all AL scenarios outperform the random baseline. However, this happens only by a few percentage points. This indicates that the models often require less data, with the exact sampling technique secondary. The most notable experiment is on Claim Detection, which achieves a 0.18 F1 increase against the random baseline.
Figure 3: Summary statistics for AL experiments
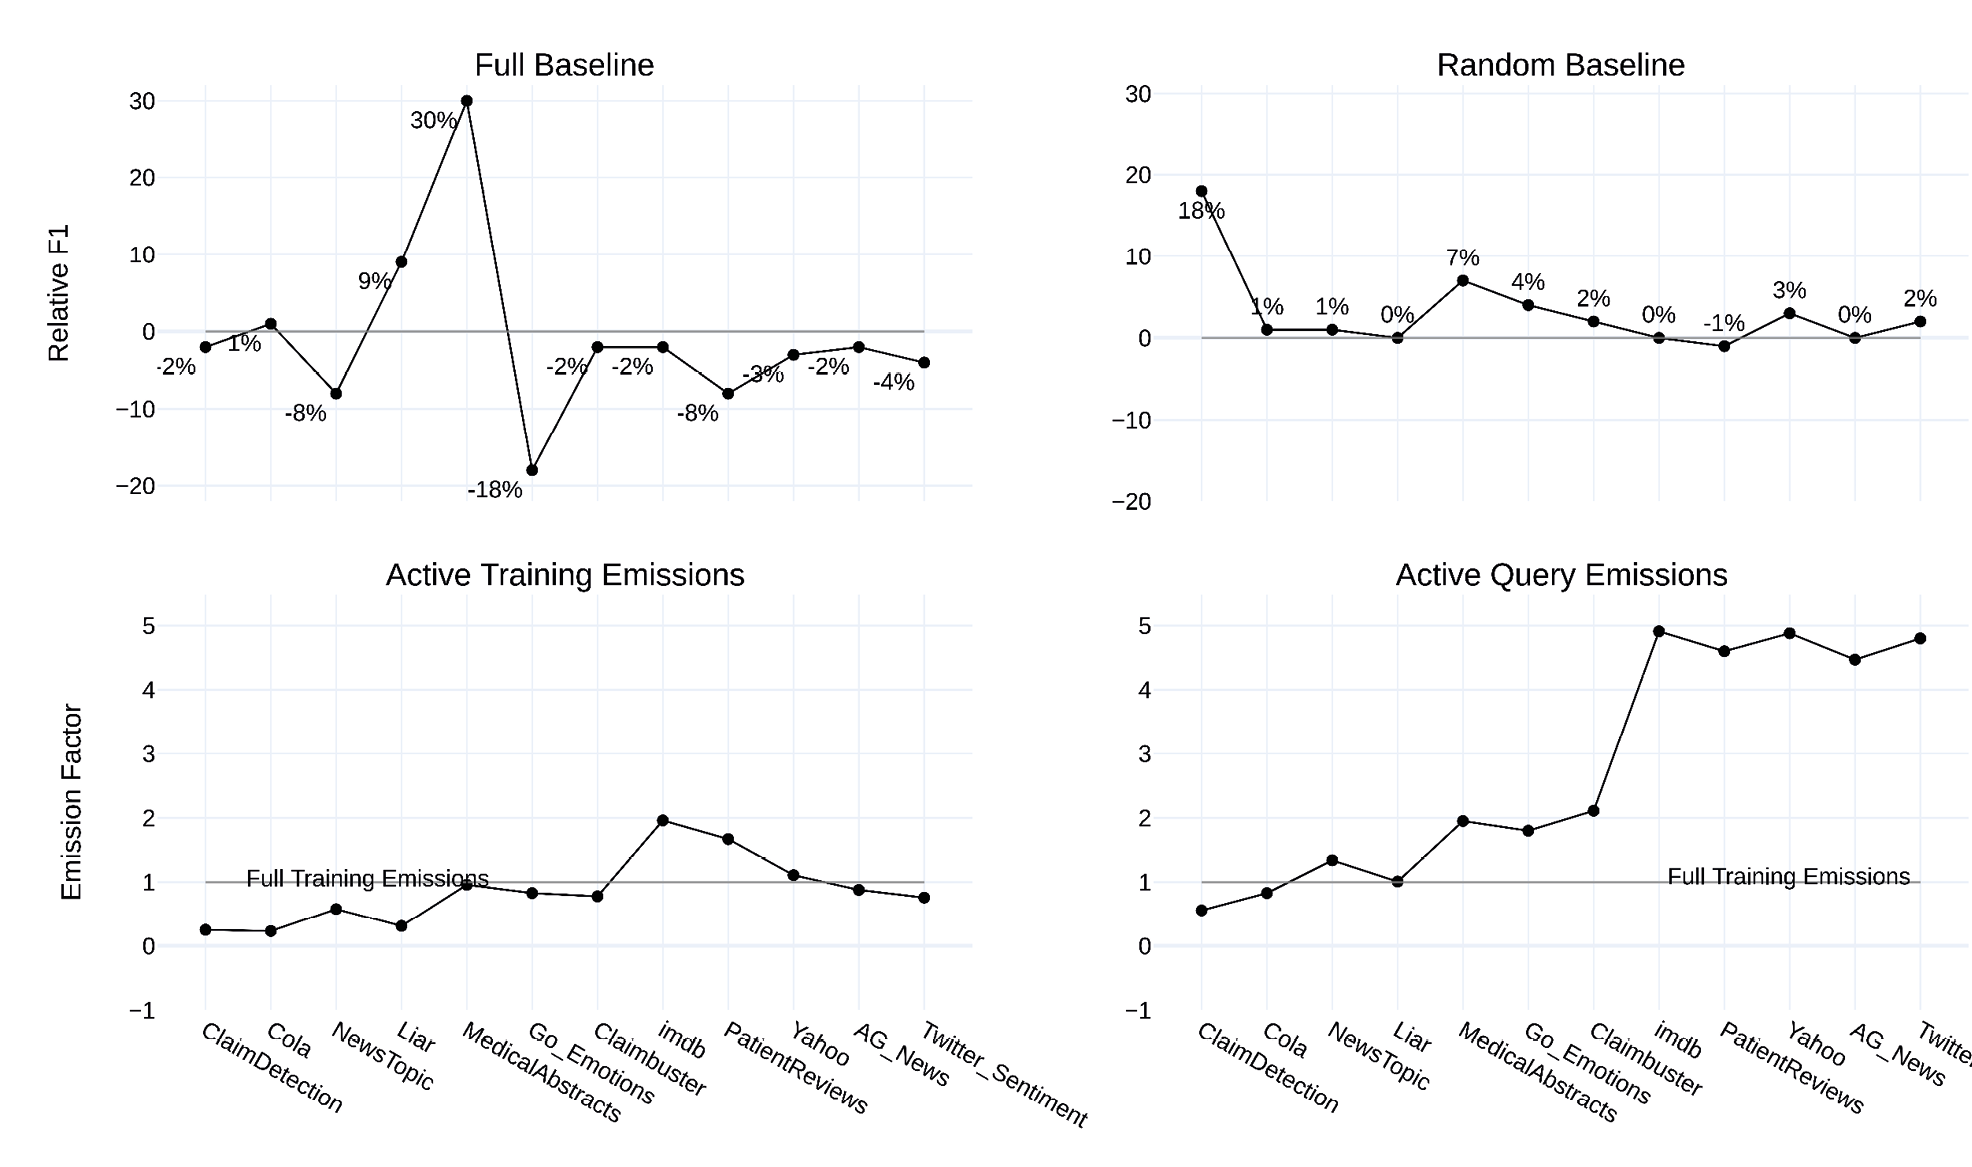
Note. For all plots, the x-axis represents the respective data set. For the full baseline, the y-axis line plot displays the difference between the best query strategy and the full baseline. For the random baseline, the y-axis line plot displays the difference between the best query strategy and the random baseline. For active training or query emissions, the y-axis displays the factor by which AL training or query is bigger or smaller than full training. All emissions are cumulative sums over each query round.
The two plots at the bottom of Figure 3 represent the cumulative emissions for active training and active querying. The data sets are ordered by size, starting with the smallest. Up to Claimbuster, active training emits just as much as full training or only a fraction of it. For larger data sets, the emissions increase by a factor of up to 2. The decrease towards the end is due to the correlation between training emissions and training set size. For larger data sets – for example, AG News or Twitter Sentiment – a smaller percentage of the Pool size is required for the best performance, making emissions lower. The major share of AL’s emissions is due to querying the Pool, as illustrated in the last plot of Figure 3. Only very small data sets produce only a fraction of the full training emissions. For all other data sets, full training emissions are exceeded by a factor of up to 4.9. In other words, querying the Pool emits almost five times as much as training on the full data set.
Figure 4 displays the results for different parameter settings. As it turns out, different step or Pool sizes have a very strong effect on emissions but only a small effect on performance. This means that tweaking the Pool or step size positively impacts efficiency. The exact numbers of all experiments can be found in Appendix C. The red circle represents the original setting of step size 50 and Pool size 100 %. The plots are partitioned by the full baselines into four sectors. The upper left sector captures performances that are higher and emissions that are lower than for full training. As expected, this sector is empty for all experiments, meaning that it is unlikely that AL outperforms TL.
Figure 4: Active Learning with different parameter settings
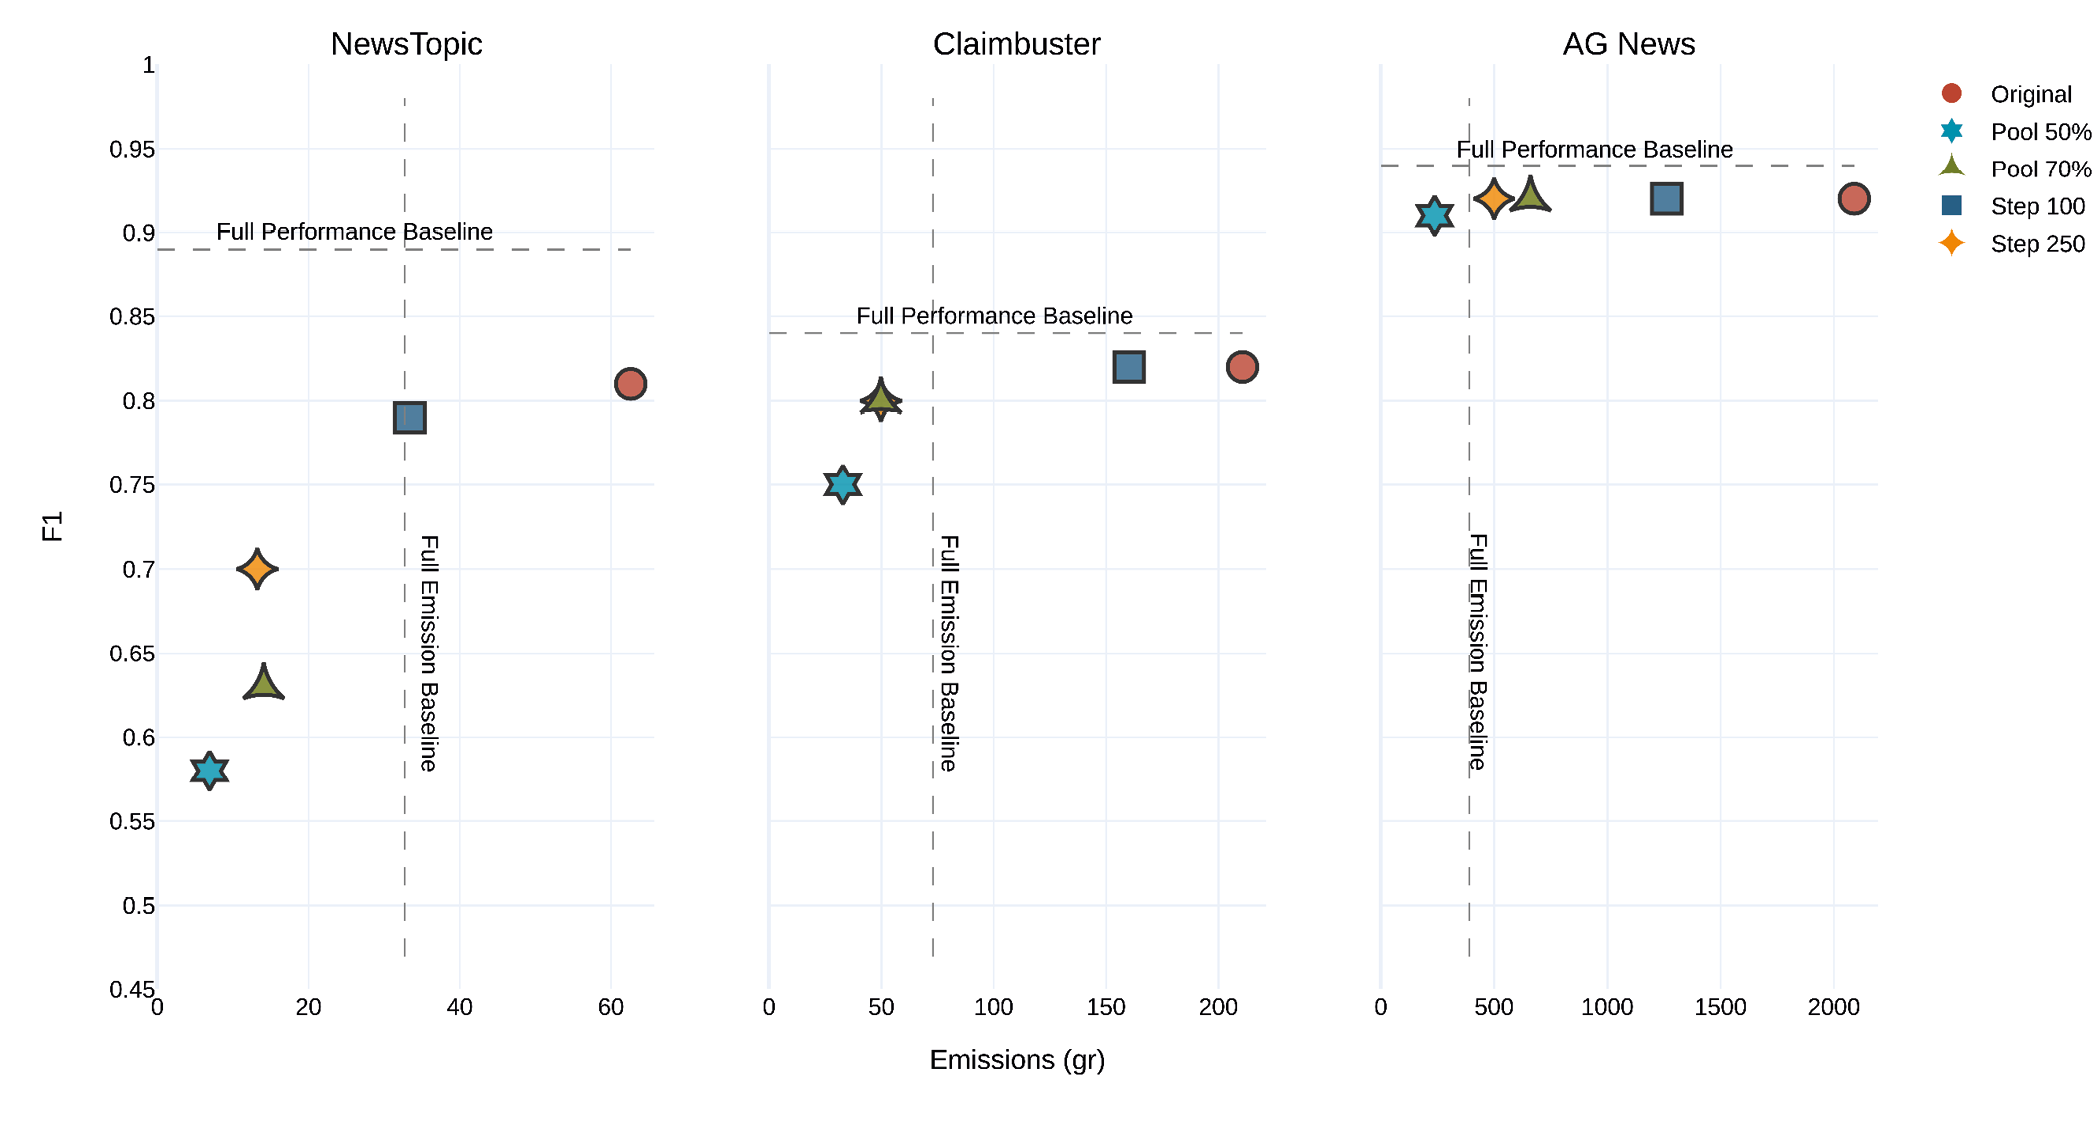
Note. Each element represents one set of parameters.
All elements are located below the full performance baseline. However, some are left of the full emissions baseline, while others are on the right. In most cases, there is a correlation between performance and emissions, meaning reduced emissions generally imply diminished performance. For all data sets, reducing step or Pool size has a positive effect on emissions, which comes as no surprise. However, while the negative impact of step size on the performance is only small, reducing the Pool size often has a high price in terms of performance. In some cases, F1 drops as much as 0.23 when reducing Pool size; however, for an increased step size, the decrease is 0.11 at most. Furthermore, the impact of reducing the Pool size seems correlated with the size of the data set. It is stronger for smaller data sets than for bigger ones. The variance in performance for different parameter settings is smaller for bigger data sets. This is unsurprising given that a reduction of 70 % (50 %) still results in large absolute numbers for large data sets. This makes the risk of limited choices less likely.
For News Topic, reducing the Pool size to 70 % (50 %) of the original size means reducing F1 to 0.63 (0.58). For News Topic, the best parameter choice is a step size of 100. This reduces the emissions down to the full baseline but reduces the performance only slightly compared to step size 50. For Claimbuster, a step size of 100 keeps the performance constant but reduces the emissions only slightly. Step size 250 and Pool size 70 % bring emissions below the full baseline but reduce performance by only 0.02, an apparently good trade-off between performance and emissions. For AG News, step size has no influence on performance but reduces emissions substantially. Reducing Pool size engenders a slight decrease in performance but a stronger reduction in emissions than reducing step size.
4 Discussion, Limitations, and Conclusion
4.1 Discussion
AL’s efficiency strongly depends on the choice of parameters
Several experiments were conducted to test the influence of step and Pool size on performance and emissions. Not surprisingly, reducing the Pool size or increasing the step size reduces emissions. However, it also diminishes performance, which is less desirable. Nonetheless, performance often decreases less than emissions, a positive result. An important finding is that, for all three data sets, it is possible to push emissions below the full baseline.
Only for some parameter settings is AL more efficient than TL
In response to the first research question (How efficient is AL in contrast to TL?), the experiments show that AL comes close to TL in terms of performance. For most data sets, the AL score is only slightly lower than the full baseline. However, in terms of emissions, AL’s carbon footprint surpasses that of TL in most scenarios. The reason for this is mostly the computational costs associated with querying the Pool. This suggests that a small initial data set precludes AL being more efficient than TL. However, for large initial data sets, AL can be more efficient, provided the step size is not too small and the Pool size not too large.
The pool size can be saturated
The second research question concerned ways of making AL more efficient. As mentioned, if the initial data set is large and the Pool size is reduced, AL can be more efficient than TL. However, reducing the Pool size limits choice when selecting the best training examples. The experiments suggest that there is a level of saturation for AL. An unlimited increase in Pool size does not correlate with ever-increasing performance. At a certain Pool size, the number of examples is such that AL could not even make a better choice even if there were more. In these scenarios, decreasing the Pool size is a good way of increasing AL’s efficiency.
Many of the present data sets are heavily oversized
A major surprise is the performance on the random baseline. With only 5.63 % of the original data set on average (std = 4.02), the random baseline’s F1 is only 0.05 below the full performance, on average (std = 0.05).15 This is only 0.03 worse compared to AL, which produces an F1 0.08 lower, on average, than the full baseline. If we ignore Claim Detection, for which AL works very well, the difference between the random baseline and AL decreases to 0.01. This means that random sampling works almost as well as AL.
This enables two conclusions. First, it is necessary to conduct further investigation into the differences between active sampling and random sampling. The actively sampled examples might still have features that are beneficial above a small increase in F1 . Second, it seems that most of the presented data sets are heavily oversized. Given that random sampling of 5.63 % of the original data set decreased F1 by 0.05, the remaining 94.37 % are responsible for only 0.05 of F1 .
4.2 Limitations
The experiments were limited to one task type and a single model architecture
Although the scope of AL has already been discussed, the present experiments have limitations of their own, most strikingly that they employ only text data and classification tasks. AL is not restricted to these formats, but it is likely that many of the results presented here also apply to other settings, such as vision and regression tasks. However, further exploration remains for future research.
Furthermore, for the experiments, only transformer models were evaluated. Text classification, however, has been approached using other architectures. The decision for transformer models was based on the observation that emissions by classical machine learning models – such as SVM or Logistic Regression – are already relatively low. Because deep learning has been demonstrated to increase required computing power (Amodei & Hernandez, 2018), performing the experiments on these architectures was a natural choice.
Although Recursive Neural Networks have been dominant in this area for many years, transformer models have more recently become most relevant. Additionally, because transformers allow for parallelizing GPUs, the computing power demanded often surpasses that of Recursive Neural Networks. Nonetheless, it cannot be determined whether the present results can be generalized to other architectures. That is, while transformer models represent a natural first step, research should not stop there.
Additionally, the experiments have focused on pre-trained transformers, in contrast to training from scratch. As mentioned, AL is used for supervised training, which does not apply to most pre-training cases. Nonetheless, it is relevant to address how fine-tuning emissions relates to pre-training emissions. This depends strongly on the size of the model. Training a single LLM – such as LLaMA 2 (Touvron et al., 2023) – can emit as much as 291 tCO2eq. This is clearly on a different level compared to the experiments in this paper. Moreover, parameter-efficient fine-tuning (Hu et al., 2021) – such as LoRA – strongly reduces the required computing power. This means that fine-tuning emissions are likely much lower than pre-training emissions.
Only one model was used (instead of an ensemble)
Previous research has shown that data sets are influenced by model choice and successor models often perform worse on the data set if they differ in their architecture from the original model (Lowell et al., 2019). This problem can be addressed by using an ensemble of different architectures. This again increases the energy costs for AL, with each additional model adding linearly to the overall cost.
Only Pool-based AL was studied
In Stream-based AL, for example, the model queries the unlabeled data successively rather than all at once (Settles, 2010). This restricts the choices for each round but also reduces the computational cost because the large (unlabeled) data set does not have to be queried as often. Future research might aim to compare Pool-based and Stream-based AL with regard to performance and efficiency.
Only (two) uncertainty-sampling strategies were studied
This article has focused on uncertainty sampling, that is, querying examples that are difficult, rather than diversity sampling, that is, querying examples by their heterogeneity in the feature space. The two approaches feature relevant differences. The problem of homogeneity, which is risked when increasing step size, does not apply to diversity sampling in the same way that it applies to uncertainty sampling. This means that the options for optimizing AL’s efficiency look different, and further research is required.
Only two uncertainty sampling strategies, Breaking Ties and Prediction Entropy, were addressed. They are the most popular strategies, with other (hybrid) strategies – for example, contrastive AL (Margatina et al., 2021) – being far more computationally expensive. Therefore, the present study suitably captures the use of AL for efficiency and sustainability.
Real-world obstacles to Active Learning
As is the case for most studies, the experiments were conducted in an artificial setup using already existing data sets, instead of using AL to create new ones from scratch. Attenberg and Provost (2011) recognize that while there has been extensive research on AL, it has not gained traction in real-world scenarios due to certain obstacles that are insufficiently addressed by the relevant studies (for different types of practical obstacles, see also Lowell et al., 2019). One obvious problem in a real-world setting is that different AL sampling strategies cannot be compared because this would require additional annotations, which AL is supposed to prevent in the first place. Another problem occurs when the data distribution is skewed. If one class appears less frequently than others, uncertainty sampling might not be the best choice. However, the distribution is not known in advance.
Similar obstacles limit the present study. As has been shown, different parameter settings in AL lead to different outcomes in terms of efficiency. An artificial setup can identify the most beneficial settings by testing different combinations, but this does not apply to real-world scenarios. The next section provides several recommendations. However, applying AL in practice still comes with uncertainties that this study does not address.
Recommendations
This study’s findings reveal that the ecological benefit of AL strongly depends on parameter settings and data set size. However, aligning with previous studies on AL, in most cases, AL can be used to decrease data set sizes. This, in turn, can lead to the democratization of machine learning research, with smaller data sets requiring fewer computational resources, making them accessible to a broader audience. Furthermore, as explained, although there are no fully representative numbers, it seems natural that a large share of current machine learning is supervised and, therefore, AL finds application. Furthermore, assuming that data sets are used multiple times, we can expect that AL’s computational costs are amortized in the long run, even though we cannot ascertain to what degree in general.
Despite not being generalizable to all possible scenarios, the present experiments allow us to make two recommendations for the use of AL for sustainable AI.
Use AL for larger projects
For smaller data sets, such as NewsTopic, AL produces more emissions than training once on the full training set. This suggests that AL has no viable application here from an ecological perspective. However, for larger data sets, such as AG News, AL combined with a high step size and low Pool size turned out to be more efficient than TL. The experiments showed that with only 50 % of the roughly 130,000 sentences as a Pool, AL achieved competitive results. The minimum required Pool size might vary with the number of class labels, but the present experiments can serve as orientation. In scenarios involving resources for annotating large data sets, it is recommended to apply AL and proceed in rounds, instead of sampling one large data set all at once. However, from an ecological perspective, it is key to also keep the Pool size small.
Pair AL with methods for increasing inference efficiency
As Figure 3 shows, most AL emissions come from querying the Pool and not training the model multiple times. This means that the most efficient way to lower the emissions associated with AL is to optimize inference. As mentioned, quantization represents one way to do this, and there have been many advances in recent times (e.g., Dettmers & Zettlemoyer, 2023). Pairing AL with model compression (only for querying the Pool) would decrease emissions without the need to compress the model permanently.
4.3 Conclusion
This paper has presented experiments testing the use of AL to reduce CO2 emissions during model training. Although smaller data sets are beneficial in this respect, the associated additional computational workload cancels out these benefits and even increases emissions compared to training on a large data set. I have argued that AL can be successfully applied in some settings, as in the case of larger projects, or by pairing it with model compression. This sets the agenda for future research. On the one hand, it is necessary to investigate how different methods for sustainable AI can be most efficiently combined, for example, quantization and AL. On the other hand, more research is needed comparing different techniques with the same aim, such as AL and data set distillation. Finally, the scope of the present study should be widened by performing experiments on more AL strategies, machine learning task types, and model architectures.
References
Ahmed, N., & Wahed, M. (2020). The de-democratization of AI: Deep learning and the compute divide in artificial intelligence research. ArXiv:2010.15581 [Cs]. http://arxiv.org/abs/2010.15581
Amodei, D., & Hernandez, D. (2018). AI and compute. https://openai.com/research/ai-and-compute
Arslan, F., Hassan, N., Li, C., & Tremayne, M. (2020). A benchmark dataset of check-worthy factual claims. Proceedings of the International AAAI Conference on Web and Social Media, 14, 821 – 829.
Attenberg, J., & Provost, F. (2011). Inactive learning?: Difficulties employing active learning in practice. ACM SIGKDD Explorations Newsletter, 12(2), 36 – 41. https://doi.org/10.1145/1964897.1964906
Bodó, Z., Minier, Z., & Csató, L. (2011). Active learning with clustering. Active learning and experimental design workshop in conjunction with AISTATS 2010, 127 – 139. https://proceedings.mlr.press/v16/bodo11a.html
Dasgupta, S. (2011). Two faces of active learning. Theoretical Computer Science, 412(19), 1767 – 1781. https://doi.org/10.1016/j.tcs.2010.12.054
Demszky, D., Movshovitz-Attias, D., Ko, J., Cowen, A., Nemade, G., & Ravi, S. (2020). GoEmotions: A dataset of fine-grained emotions. arXiv.
https://arxiv.org/abs/2005.00547
Dettmers, T., Lewis, M., Shleifer, S., & Zettlemoyer, L. (2022). 8-bit optimizers via block-wise quantization. arXiv. http://arxiv.org/abs/2110.02861
Dettmers, T., Pagnoni, A., Holtzman, A., & Zettlemoyer, L. (2023). QLoRA: Efficient finetuning of quantized LLMs. arXiv. https://arxiv.org/abs/2305.14314
Dettmers, T., & Zettlemoyer, L. (2023). The case for 4-bit precision: K-bit Inference Scaling Laws. Proceedings of the 40th International Conference on Machine Learning, 7750 – 7774. https://proceedings.mlr.press/v202/dettmers23a.html
Diao, S., Wang, P., Lin, Y., & Zhang, T. (2023). Active prompting with chain-of-thought for large language models. arXiv. http://arxiv.org/abs/2302.12246
Henderson, P., Hu, J., Romoff, J., Brunskill, E., Jurafsky, D., & Pineau, J. (2020). Towards the systematic reporting of the energy and carbon footprints of machine learning. arXiv. http://arxiv.org/abs/2002.05651
Hintemann, R., & Hinterholzer, S. (2020). Videostreaming: Energiebedarf und CO2-Emissionen [Hintergrundpapier]. Borderstep Institut für Innovation und Nachhaltigkeit gemeinnützige GmbH.
Hu, E. J., Shen, Y., Wallis, P., Allen-Zhu, Z., Li, Y., Wang, S., Wang, L., & Chen, W. (2021). LoRA: Low-Rank adaptation of large language models (arXiv:2106.09685). arXiv. https://doi.org/10.48550/arXiv.2106.09685
Icha, P., Lauf, T., & Kuhs, G. (2022). Entwicklung der spezifischen Treibhausgas-Emissionen des deutschen Strommix in den Jahren 1990 – 2021. Umweltbundesamt. https://www.umweltbundesamt.de/publikationen/entwicklung-der-spezifischen-kohlendioxid-8
Kaack, L. H., Donti, P. L., Strubell, E., Kamiya, G., Creutzig, F., & Rolnick, D. (2022). Aligning artificial intelligence with climate change mitigation. Nature Climate Change, 12, 518 – 527. https://doi.org/10.1038/s41558-022-01377-7
Lottick, K., Susai, S., Friedler, S. A., & Wilson, J. P. (2019). Energy usage reports: Environmental awareness as part of algorithmic accountability. arXiv. http://arxiv.org/abs/1911.08354
Lowell, D., Lipton, Z. C., & Wallace, B. C. (2019). Practical obstacles to deploying active learning. Proceedings of the 2019 Conference on Empirical Methods in Natural Language Processing and the 9th International Joint Conference on Natural Language Processing (EMNLP-IJCNLP), 21 – 30. https://doi.org/10.18653/v1/D19-1003
Luccioni, A. S., & Rogers, A. (2023). Mind your language (model): Fact-checking LLMs and their tole in NLP research and practice. arXiv. https://arxiv.org/abs/2308.07120
Luccioni, A. S., Viguier, S., & Ligozat, A.-L. (2022). Estimating the carbon footprint of BLOOM, a 176B Parameter Language Model. arXiv. http://arxiv.org/abs/2211.02001
Maas, A. L., Daly, R. E., Pham, P. T., Huang, D., Ng, A. Y., & Potts, C. (2011). Learning word vectors for sentiment analysis. Proceedings of the 49th Annual Meeting of the Association for Computational Linguistics: Human Language Technologies, 142 – 150. https://aclanthology.org/P11-1015
Margatina, K., Vernikos, G., Barrault, L., & Aletras, N. (2021). Active learning by acquiring contrastive examples. Proceedings of the 2021 Conference on Empirical Methods in Natural Language Processing, 650 – 663. https://doi.org/10.18653/v1/2021.emnlp-main.51
Menghani, G. (2021). Efficient deep learning: A survey on making deep learning models smaller, faster, and better. arXiv. http://arxiv.org/abs/2106.08962
Mitchell, M., Luccioni, A. S., Lambert, N., Gerchick, M., McMillan-Major, A., Ozoani, E., Rajani, N., Thrush, T., Jernite, Y., & Kiela, D. (2022). Measuring data. arXiv. http://arxiv.org/abs/2212.05129
Naji, I. (2012). TSATC: Twitter sentiment analysis training corpus. Thinknook.
Northcutt, C. G., Jiang, L., & Chuang, I. L. (2022). Confident learning: Estimating uncertainty in dataset labels. arXiv. http://arxiv.org/abs/1911.00068
Regneri, M., Georgi, J. S., Kost, J., Pietsch, N., & Stamm, S. (2019). Computing the value of data: towards applied data minimalism. arXiv.
http://arxiv.org/abs/1907.12404
Ren, P., Xiao, Y., Chang, X., Huang, P.-Y., Li, Z., Gupta, B. B., Chen, X., & Wang, X. (2021). A survey of deep active learning. ACM Computing Surveys, 54(9), 180:1 – 40. https://doi.org/10.1145/3472291
Risch, J., Stoll, A., Wilms, L., & Wiegand, M. (2021). Overview of the GermEval 2021 shared task on the identification of toxic, engaging, and fact-claiming comments. Proceedings of the GermEval 2021 Shared Task on the Identification of Toxic, Engaging, and Fact-Claiming Comments, 1 – 12. https://aclanthology.org/2021.germeval-1.1
Rohde, F., Wagner, J., Reinhard, P., Petschow, U., Meyer, A., Voß, M., & Mollen, A. (2021). Nachhaltigkeitskriterien für künstliche Intelligenz. Schriftenreihe Des IÖW, 220, 21.
Sanh, V. (n.d.). DistilBERT, a distilled version of BERT: smaller, faster, cheaper and lighter. arXiv. https://arxiv.org/abs/1910.01108
Schopf, T., Braun, D., & Matthes, F. (2023). Evaluating unsupervised text classification: zero-shot and similarity-based approaches. arXiv.
https://doi.org/10.48550/arXiv.2211.16285
Schröder, C., Niekler, A., & Potthast, M. (2022). Revisiting uncertainty-based query strategies for active learning with transformers (arXiv:2107.05687). arXiv. https://doi.org/10.48550/arXiv.2107.05687
Schwartz, R., Dodge, J., Smith, N. A., & Etzioni, O. (2020). Green AI. Communications of the ACM, 63(12), 54 – 63. https://doi.org/10.1145/3381831
Settles, B. (2009). Active learning literature survey (Computer Sciences Technical Report 1648). University of Wisconsin–Madison.
Sorscher, B., Geirhos, R., Shekhar, S., Ganguli, S., & Morcos, A. S. (2023). Beyond neural scaling laws: Beating power law scaling via data pruning (arXiv:2206.14486). arXiv. https://doi.org/10.48550/arXiv.2206.14486
Strubell, E., Ganesh, A., & McCallum, A. (2019). Energy and policy considerations for deep learning in NLP. Proceedings of the 57th Annual Meeting of the Association for Computational Linguistics, 3645 – 3650. https://doi.org/10.18653/v1/P19-1355
Touvron, H., Martin, L., & Stone, K. (2023). Llama 2: Open foundation and fine-tuned chat models. arXiv. https://arxiv.org/abs/2307.09288
Treviso, M., Ji, T., Lee, J.-U., van Aken, B., Cao, Q., Ciosici, M. R., Hassid, M., Heafield, K., Hooker, S., Martins, P. H., Martins, A. F. T., Milder, P., Raffel, C., Simpson, E., Slonim, N., Balasubramanian, N., Derczynski, L., & Schwartz, R. (2022). Efficient methods for natural language processing: A survey (arXiv:2209.00099). arXiv. https://doi.org/10.48550/arXiv.2209.00099
van Wynsberghe, A. (2021). Sustainable AI: AI for sustainability and the sustainability of AI. AI and Ethics, 1(3), 213 – 218. https://doi.org/10.1007/s43681-021-00043-6
Wang, T., Zhu, J.-Y., Torralba, A., & Efros, A. A. (2020). Dataset distillation (arXiv:1811.10959). arXiv. https://doi.org/10.48550/arXiv.1811.10959
Wang, W. Y. (2017). “Liar, liar pants on fire”: A new benchmark dataset for fake news detection. ArXiv:1705.00648 [Cs]. http://arxiv.org/abs/1705.00648
Warstadt, A., Singh, A., & Bowman, S. R. (2019). Neural network acceptability judgments (arXiv:1805.12471). arXiv. https://doi.org/10.48550/arXiv.1805.12471
Wiesner, P., Behnke, I., Scheinert, D., Gontarska, K., & Thamsen, L. (2021). Let’s wait awhile: How temporal workload shifting can reduce carbon emissions in the cloud. Proceedings of the 22nd International Middleware Conference, 260 – 272. https://doi.org/10.1145/3464298.3493399
Wu, C.-J., Raghavendra, R., Gupta, U., Acun, B., Ardalani, N., Maeng, K., Chang, G., Behram, F. A., Huang, J., Bai, C., Gschwind, M., Gupta, A., Ott, M., Melnikov, A., Candido, S., Brooks, D., Chauhan, G., Lee, B., Lee, H.-H. S., … Hazelwood, K. (2021). Sustainable AI: Environmental implications, challenges and opportunities. arXiv. https://arxiv.org/abs/2111.00364
Xu, J., Zhou, W., Fu, Z., Zhou, H., & Li, L. (2021). A survey on green deep learning (arXiv:2111.05193). arXiv. https://doi.org/10.48550/arXiv.2111.05193
Yu, R., Liu, S., & Wang, X. (2023). Dataset distillation: A comprehensive review (arXiv:2301.07014). arXiv. https://doi.org/10.48550/arXiv.2301.07014
Yuan, M., Lin, H.-T., & Boyd-Graber, J. (2020). Cold-start active learning through self-supervised language modeling. Proceedings of the 2020 Conference on Empirical Methods in Natural Language Processing (EMNLP), 7935 – 7948. https://doi.org/10.18653/v1/2020.emnlp-main.637
Zhang, X., & LeCun, Y. (2016). Text understanding from scratch (arXiv:1502.01710). arXiv. http://arxiv.org/abs/1502.01710
Appendix A
One major Active Learning strategy involves sampling examples that the model is most uncertain about. The underlying assumption is that the model learns more from examples it is not certain about than from examples that it is certain about. Uncertainty of a model θ is expressed in its prediction probability for the given classes Pθ (y ̂ |x). One Active Learning strategy is called Breaking Ties or Margin Sampling (Settles, 2009):
x* = argminx Pθ (y ̂ 1 |x)–Pθ (y ̂ 2 |x)
Where x* is the most informative example and y ̂ 1 and y ̂ 2 are the first and second most likely classes. For example, if the model predicts class A with a probability of 0.8 and class B with a probability of 0.15 (the remaining 0.05 is spread among the other classes), the margin is 0.65. This is quite high because the model is confident in its prediction. If it is uncertain and predicts 0.4 and 0.3 instead, the margin is only 0.1. In this version, active sampling means computing the margin for all examples in the pool and then labeling those with the lowest margin.
However, margin sampling only considers the two most likely classes. By contrast, the most popular Active Learning strategy, prediction entropy (or entropy sampling), utilizes the probabilities for all classes:
x* = argmaxx –  ∑i
∑i  Pθ (y ̂ � |x)logPθ (y ̂ � |x)
Entropy sampling concerns finding the sampling examples from the pool that have the largest entropy. The larger the entropy, the closer the distribution to uniform. A uniform distribution of class probabilities means that the model finds all classes equally likely, which expresses a maximum degree of uncertainty.
Appendix B
Table A1: Top performance on different data sets
|
Data Use (%) |
Performance (F1 ) |
Emissions (gr.) |
|||||||
|
Data set |
Query |
Active |
Random |
Full |
Active |
Random |
Full |
Active |
Random |
|
Claim Detection |
BT |
9.52 |
0.99 |
.73 |
.71 |
.53 |
12.7 |
10.3 |
0.1 |
|
Cola |
PE |
6.23 |
1.0 |
.58 |
.59 |
.58 |
29.6 |
31.5 |
0.2 |
|
News Topic |
BT |
9.34 |
9.34 |
.89 |
.81 |
.80 |
32.7 |
62.6 |
20.3 |
|
Liar |
BT |
6.01 |
3.78 |
.07 |
.16 |
.16 |
39.3 |
51.9 |
4.8 |
|
Medical Abstracts |
PE |
9.9 |
9.41 |
.17 |
.47 |
.40 |
45.5 |
132.1 |
39.9 |
|
GoEmotions |
BT |
8.97 |
9.44 |
.64 |
.46 |
.42 |
46.9 |
123.5 |
43.3 |
|
Claimbuster |
BT |
7.07 |
8.59 |
.84 |
.82 |
.80 |
72.9 |
210.7 |
85.9 |
|
imdb |
BT |
7.57 |
6.86 |
.94 |
.92 |
.92 |
157.6 |
1082.9 |
251.7 |
|
Patient Reviews |
BT |
6.82 |
9.53 |
.54 |
.46 |
.47 |
162.8 |
1020.8 |
535.1 |
|
Yahoo |
BT |
3.92 |
1.19 |
.77 |
.74 |
.71 |
344.0 |
2057.7 |
14.8 |
|
AG News |
BT |
3.29 |
8.39 |
.94 |
.92 |
.92 |
390.8 |
2089.6 |
2431.5 |
|
Twitter Sentiment |
PE |
2.48 |
1.0 |
.85 |
.81 |
.79 |
652.0 |
3620.7 |
6.2 |
Appendix C
Table A2: Results for different parameter settings
|
Data Use (%) |
Performance (F1 ) |
Emissions (gr.) |
||||||||
|
Data set |
Query |
Active |
Random |
Full |
Active |
Random |
Full |
Active |
Random |
|
|
50 |
AG News |
BT |
3.29 |
4.47 |
.94 |
.92 |
.91 |
391 |
2090 |
664 |
|
Claimbuster |
BT |
7.07 |
8.59 |
.84 |
.82 |
.80 |
73 |
211 |
86 |
|
|
News Topic |
BT |
9.34 |
9.34 |
.89 |
.81 |
.80 |
33 |
63 |
20 |
|
|
AG News |
BT |
3.69 |
4.02 |
.94 |
.92 |
.91 |
391 |
1262 |
271 |
|
|
100 |
Claimbuster |
BT |
9.5 |
8.89 |
.84 |
.82 |
.80 |
73 |
160 |
47 |
|
News Topic |
BT |
9.34 |
9.34 |
.89 |
.79 |
.75 |
33 |
33 |
11 |
|
|
AG News |
BT |
3.52 |
4.64 |
.94 |
.92 |
.91 |
391 |
500 |
153 |
|
|
250 |
Claimbuster |
BT |
7.07 |
8.59 |
.84 |
.80 |
.73 |
73 |
50 |
20 |
|
News Topic |
PE |
7.95 |
7.95 |
.89 |
.70 |
.74 |
33 |
13 |
4 |
|
|
AG News |
BT |
4.60 |
5.08 |
.94 |
.92 |
.91 |
391 |
660 |
171 |
|
|
70 |
Claimbuster |
BT |
7.94 |
9.24 |
.84 |
.80 |
.77 |
73 |
50 |
20 |
|
News Topic |
BT |
9.93 |
9.93 |
.89 |
.63 |
.70 |
33 |
14 |
5 |
|
|
AG News |
BT |
3.58 |
3.58 |
.94 |
.91 |
.90 |
391 |
238 |
42 |
|
|
50 |
Claimbuster |
BT |
9.49 |
8.89 |
.84 |
.75 |
.73 |
73 |
33 |
10 |
|
News Topic |
PE |
9.34 |
7.95 |
.89 |
.58 |
.53 |
33 |
7 |
2 |
|
Note. 50, 100, and 250 denote different step sizes; 70 and 50 denote percentages of the Pool.
Appendix D
Table A3: Task types on Hugging Face
|
Task |
Count |
|
text-classification |
35,650 |
|
reinforcement-learning |
24,467 |
|
text2text-generation |
17,968 |
|
text-generation |
15,578 |
|
token-classification |
9,698 |
|
automatic-speech-recognition |
9,080 |
|
fill-mask |
7,792 |
|
feature-extraction |
6,675 |
|
question-answering |
5,607 |
|
text-to-image |
5,172 |
|
image-classification |
4,602 |
|
other |
11,308 |
Note. The count indicates how many models on the platform are designed for the respective task. Data accessed at the beginning of July 2023.
Acknowledgement
Thanks to Hadi Asghari for providing very useful feedback throughout the process, double-checking the code, and making helpful comments on earlier versions of this article.
Date received: August 2023
Date accepted: March 2024
1 https://www.technologyreview.com/2019/06/06/239031/training-a-single-ai-model-can-emit-as-much-carbon-as-five-cars-in-their-lifetimes/
2 Code and data can be found on the author’s GitHub page: https://github.com/SamiNenno/Sustainable-Data
6 Thanks to an anonymous reviewer for pointing me to it.
7 Sometimes these approaches are called Passive Learning.
8 See Attenberg and Provost (2011) and Lowell et al. (2019) for discussions of the problems and practical obstacles of AL.
15 Liar and Medical Abstracts are excluded because of their weak full baseline.