
Can Sustainable Shopping Recommendations in Online Retail Help Reduce Global Warming?
Assessing the Direct and Indirect Climate Impact of Modern Software
1 Introduction
As outlined in the Sixth Assessment Report of the Intergovernmental Panel on Climate Change (IPCC), drastic action is needed to reduce global greenhouse gas (GHG) emissions and limit the average annual global temperature increase to 1.5°C (IPCC, 2022). The development and use of information and communication technology (ICT), often referred to as digitalization, has raised high hopes for reducing energy demand and GHG emissions. Policymakers and practitioners have frequently argued that digital innovations can help combat climate change (GeSI, 2015; European Commission, 2022). According to a report published as part of the Green Growth papers by the Organization for Economic Cooperation and Development (OECD), innovative ICT applications can contribute to reducing greenhouse gas emissions in many ways, including through product-specific improvements, such as optimizing the energy efficiency of other products – for example, smart heating and lighting systems in buildings – or enabling whole-system improvements for more sustainable production, consumption, and lifestyles (Mickoleit, 2010). The notion of ICT-enabled reductions of GHG emissions is supported by research examining, for example, the replacement of a face-to-face conference with a virtual conference (Jäckle, 2021), the relationship between ICT and energy demand in OECD countries (Schulte et al., 2016), and ICT-enabled impacts on the energy efficiency of household behavior (Bastida et al., 2019).
Yet already over a decade ago, Arvesen et al. (2011) cautioned against excessive optimism regarding the effectiveness of technologies in mitigating climate change. They recognized that evaluations tend to overlook indirect effects and interactions within both natural and social systems (ibid.). In recent years, increasing studies have examined the carbon footprint of ICT and considered its potential negative impact on climate. Estimates of global GHG emissions from ICT vary widely, ranging from 1.8 % to 2.8 %, depending on the assumptions and scale underlying the studies (Andrae & Edler, 2015; Belkhir & Elmeligi, 2018; Malmodin, 2020). A review of various studies conducted by Freitag et al. (2021) suggests that GHG emissions from ICT could actually be higher, accounting for around 2.1 % to 3.9 % of global GHG emissions. Furthermore, the authors note a consensus across all reviewed studies indicating that these emissions will not decrease without political and industrial efforts and will even increase in the future.
ICT is associated with various direct and indirect emissions. The classifications and terms used to define these emissions vary between different approaches, and no standard terminology has yet been established (Horner et al., 2016). In many studies, the term “direct emissions” refers to energy and hardware-related GHG emissions of ICT, such as the emissions caused by the extraction of the required raw materials or the carbon intensity of the electricity used. In contrast, the term “indirect emissions” is often used to describe the impacts that the application of ICT has on other systems and sectors, such as consumer behavior, which can be both positive and negative (Arvesen et al., 2011; Horner et al., 2016). One type of these indirect effects associated with behavioral changes is referred to as “rebound effects.” These effects can occur when, for instance, the use of ICT to improve energy efficiency leads to increased energy consumption and economic growth (Lange et al., 2020). Whether ICT’s positive effects on climate change outweigh the negative effects continues to be a subject of research.
Studies assessing the climate impacts of ICT have often focused on hardware (Arushanyan et al., 2014; Horner et al., 2016; Hoosain et al., 2023). For example, studies have examined emissions from data centers (Hoosain et al., 2023) and smartphone life cycles (Clément et al., 2020; Sánchez et al., 2022) and considered the environmental impacts of substituting material goods with digital goods (Pohl et al., 2019). In contrast to hardware, studies assessing the climate impact of software are comparatively new, meaning neither methods nor standards have yet been established. Although software products are intangible goods, they influence the energy demand of hardware through factors including the software’s data volume, data traffic, and computing power requirements (Gröger et al., 2018). With the increasing use of machine learning (ML), such as in the form of large language models (LLMs) for chatbots such as GPT-4, questions around the energy demands of this technology have attracted the attention of researchers and practitioners in recent years (Strubell et al., 2019; Bender et al., 2021; Kaack et al., 2022; Luccioni et al., 2022). While Rolnick et al. (2023) outline several domains where ML can be used to combat climate change, such as enabling low-carbon electricity, reducing transportation activity, or facilitating behavior change, studies are increasingly also assessing the impact of ML models on GHG emissions (Amodei & Hernandez, 2018; Strubell et al., 2019; Zhang et al., 2022).
To contribute to the reduction of global GHG emissions, both ICT in general and ML-based software in particular must ensure that their positive impacts outweigh their negative impacts. Therefore, both direct and indirect impacts must be evaluated across the life cycle of each application. In this article, we build on recent research and describe an attempt to assess the direct and indirect impacts of a given ML-based software on GHG emissions, which we refer to as net impacts. Our study aims to provide an assessment of the net impact of modern software in real-world applications, focusing on online commerce and sustainable purchasing recommendations.
The software application examined in this study is designed to support sustainable purchase decisions and was developed as part of the Green Consumption Assistant (GCA) research project. The goal of the GCA project is the promotion of sustainable consumption on the search engine Ecosia1, such as by encouraging users to buy products with a lower environmental impact than comparative products that they would otherwise purchase. The automated sustainable shopping recommendations on Ecosia’s shopping vertical rely on several steps, such as data scraping from product web pages in online shops, computing, and the training and usage of an ML model, all of which require energy. We analyze the solution developed by the GCA and conduct a case study to evaluate the overall impact on global warming potential (GWP) – measured in carbon dioxide equivalents (CO2 e) – of a sustainability-focused software system with modern ML components. To perform this assessment, we follow a life-cycle perspective that considers user behavior and existing product life-cycle assessments (LCAs) to estimate the potential indirect contribution of the automated sustainable shopping recommendations to emission avoidance. To assess the energy consumption of the software, we use CodeCarbon, an existing measuring tool. We apply these to our use case to obtain estimates of the climate-related positive and negative impacts, as well as estimates of the relative contributions of the various steps in the development, execution, and use of the software. This approach allows us to directly compare the energy consumption of a state-of-the-art recommender system with the estimated GHG emissions avoided by promoting sustainable purchase decisions. To evaluate the overall GWP of our use case sustainability-oriented software, we identify areas characterized by high energy consumption, as well as areas with savings potential. However, it is important to recognize that it is not possible to obtain precise figures using this approach.
In the following, we provide an overview of the current research on the direct and indirect impacts of software systems – especially ML models – on GHG emissions. We focus on related work on relevant methodologies and frameworks, as well as initial empirical studies and open-source tools (Chapter 2). We also briefly describe the development background of the automated sustainable product recommendations provided by GCA (Chapter 3) before presenting our methodology (Chapter 4) and results (Chapter 5). After discussing the limitations of this study and identifying avenues for further research (Chapter 6), we summarize this study’s main findings (Chapter 7).
2 Scientific Background
There are several studies, methodologies, and frameworks that address the climate impacts of software, in general, and ML models, in particular. In this chapter, we briefly describe relevant methodologies and frameworks, empirical studies and tools, and related work on the indirect impacts of software on consumption.
2.1 Approaches to Assessing the Environmental and Climate Impact of Software
When evaluating the environmental impact of products and services, researchers often conduct LCAs, which represent a systematic method for evaluating the environmental impacts over the entire life cycle of a product or service, as defined in the International Organization for Standardization standards ISO 14040 and 14044 (ISO, 2006). Applying a life-cycle perspective to the environmental impacts of digitalization was the subject of the 73rd Discussion Forum on Life Cycle Assessment in 2019 (Itten et al., 2020), with experts arguing that LCAs can guide a more environmentally sustainable digital transformation by identifying environmental hotspots within ICT, revealing trade-offs, monitoring the consequences of digital transformation, and highlighting the sustainability potential of substituting digital for non-digital technologies with high environmental impacts. Despite these remarks, comprehensive standards and inventory data remain limited, and the use of a life-cycle approach to assess software sustainability remains relatively uncommon.
One study that considers the life-cycle perspective in relation to software products was conducted by Kern et al. (2018), who developed a model describing the causal chains from software products to their impacts on natural resources, including energy sources. Their research emphasized that the software product contributes measurably to the life cycle of all necessary hardware products (Kern et al., 2018).
In another study, Gröger et al. (2018) developed an impact model that illustrates the relationship between software use and hardware energy consumption, as well as hardware use (i.e., impact on hardware’s useful life). As part of their research, the researchers created a catalog of criteria and indicators for assessing the environmental impact of software products, providing an important contribution for software sustainability research.
In the context of ML-based software, several studies have also developed various methods and frameworks to account for direct and indirect impacts on GHG emissions. In a recent article, Kaack et al. (2022) introduced a systematic framework that divides the ML model’s effects on GHG emissions into three categories: A) computing-related impacts, B) direct application impacts, and C) system-level impacts. All three categories differ significantly in terms of their potential emissions. Computing-related impacts include all GHG emissions caused by computation, both from electricity used for ML and embodied emissions associated with the hardware employed, such as the extraction of resources or the manufacturing of the hardware. Categories B and C are more similar. While direct application impacts (B) refer to the “immediate” GHG emissions impacts associated with the short-term outcomes of ML applications, system-level impacts (C) refer to the structural or “system-related” GHG effects caused by these applications (Kaack et al., 2022).
This highlights the problem that there is not yet a commonly agreed-upon framework for assessing such systems, and it is not very common yet to follow a cradle-to-grave LCA.
2.2 Empirical Studies Assessing the Energy- and Resource-Related Emissions of Software
Beyond frameworks and methods concerning ML models, several studies have measured the impact of training and deploying an LLM across its life cycle.
For example, Wu et al. (2022) measured the carbon footprint of LLMs while also considering the life cycle of the system hardware. To measure this impact, they provide their own estimates without using an already existing tool. For example, they estimate that training GPT-3, a generative language model used to produce human-like texts, has a carbon footprint of 600k kg CO2 and that about 800k kg of CO2 e are emitted during the training and inference of one of Facebook’s recommendation and ranking models.
Aligning with the framework introduced by Kaack et al. (2022), Luccioni et al. (2022) evaluated the computing-related emissions associated with training BLOOM, a 176-billion-parameter LLM. They found that training BLOOM accounts for the production of 433,196 kWh. They provide manual estimates of the dynamic power consumption during the training of the model and the idle power consumption. To obtain emissions estimates associated with the inference they run the CodeCarbon tool on a Google Cloud Platform. To quantify the embodied emissions associated with training the BLOOM model they use secondary data from a published LCA of comparable computing equipment. Due to a lack of information on their distribution and use, the embodied emissions of the remaining computing infrastructure have not been considered. They explain their steps as part of the life-cycle phases Equipment Manufacturing, Model Training, and Model Deployment. Meanwhile, Wu et al. (2022) provide different breakdowns of their estimates using the categories online training, offline training, inference, and operational and embodied energy. Operational and embodied energy is another way of defining software’s direct impact and the phases of such systems.
To obtain estimates of the power consumption of ML models and other software components, data on the emissions of energy grids and the power output of graphics processing units (GPUs) and central processing units (CPUs) are needed. To this end, a handful of open-source libraries have been developed that attempt to measure the CO2 impact of software, in particular, ML models. In addition to CodeCarbon – used by Luccini et al. (2022) – other licensed open-source libraries include Cloud Carbon Footprint2, CarbonTracker (Anthony et al., 2020), Tracarbon3, Green Algorithms (Lannelongue et al., 2020), eco2AI (Budennyy et al., 2022), and Pinpoint (Köhler et al., 2020). However, Bannour et al. (2021) have recognized that there exists an array of estimates between libraries, differences that suggest that calculating such estimates requires a holistic understanding of the entire process and addressing other hardware aspects, rather than focusing entirely on dynamic timing. Therefore, despite the existence of these libraries, some researchers still choose to produce energy consumption estimates using their own method (Patterson et al., 2022; Touvron et al., 2023; Wu et al., 2022). For instance, Patterson et al. (2021) measured GPU energy consumption alone, and Selvan et al. (2022) used CarbonTracker for its predictive emissions features. This shows there isn’t a single widely accepted library.
2.3 Indirect Environmental Impacts of Software and Machine Learning Models
In addition to the challenges of measuring the energy-related environmental impacts of software, especially ML models, several studies also recognize the need to consider indirect impacts, including system-level impacts, on sectors such as transport, agriculture, and consumer behavior (Kaack et al., 2022; Luccioni et al., 2022).
In a literature review, Horner et al. (2016) assessed the indirect energy impacts of ICT and developed a taxonomy of ICT energy impacts that standardizes the terms used in the literature. Overall, they found that the actual net energy effect is difficult to assess and that indirect energy effects are very sensitive to scoping decisions and assumptions made by the analyst. Additionally, they observed that uncertainty increases as the impact scope broadens. They also noted broad agreement among researchers that although ICT offers great potential for energy savings, realizing this potential depends heavily on the actual details of deployment and user behavior (Horner et al., 2016).
A potential system-level impact occurs when ML technologies cause broader lifestyle changes in society, such as by altering demand for goods and services. Behavior research suggests that digitization has the potential to encourage pro-ethical or pro-sustainable choices by consumers (Cochoy et al., 2017; Frick et al., 2019; Fuentes & Sörum, 2019). In contrast, an example of a likely negative impact on global GHG emissions is ML algorithms such as recommender systems or personalized ads in search engines, which may encourage increased consumption of goods and services with embodied GHG emissions (Chen, 2022; Fleder et al., 2010). In the general context of online advertising, the success with which advertising in applications converts users is evaluated using the conversion rate (CVR). The CVR refers to the percentage of users who saw an in-application ad, clicked on it, and converted through a predetermined action. Irvine (2021) analyzed thousands of shopping ads on Google and Bing and found that the average CVR across all industries was 1.91 % for Google Shopping ads and 1.74 % for Bing Shopping ads.
3 Study Focus and Research Questions
Ecosia provides a shopping vertical where users can search for and eventually purchase products from various retailers. To promote sustainable consumption, the GCA project has developed additional features that are presented to the platform’s users in the shopping vertical. One main feature is the automated recommendation of sustainable products. The GCA considers products to be sustainable if they credibly meet higher social and environmental sustainability standards than comparable products. To determine a product’s sustainability, the GCA evaluates and scores products against a set of criteria described in previous GCA research (Hoffmann, 2022; Lehmann, 2021).
As Figure 1 shows, the software enables an automated change from A) displaying regular shopping results in Ecosia’s shopping vertical to B) allocating the first row to recommend sustainable products that are highlighted through the “sustainability” label. While the infrastructure and basic features of the shopping vertical remain unchanged by the GCA software, users searching for specific products in Ecosia’s shopping vertical are now shown four sustainable products above the regular product recommendations.
Figure 1: A) Display of regular shopping results in Ecosia’s shopping vertical. B) Display of sustainable alternatives to shopping results in Ecosia’s shopping vertical.
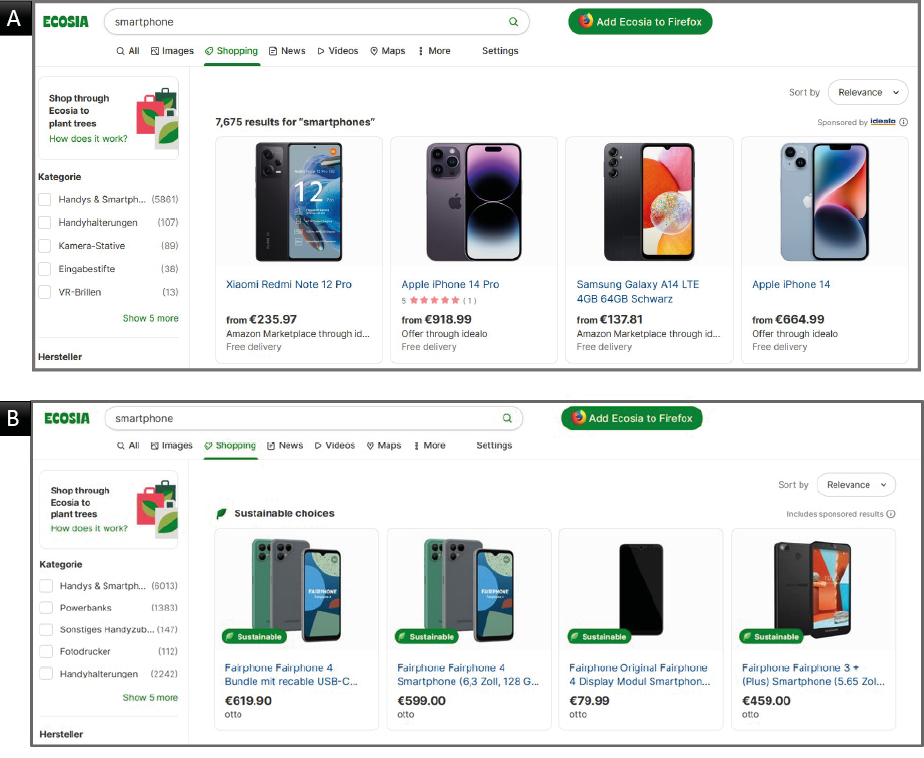
The automated display of sustainable product alternatives was mainly achieved by creating the GreenDB (Jäger et al., 2022), a product-based sustainability database. The GreenDB is a PostgreSQL database that is updated weekly with an automated pipeline available on Github4. The GreenDB searches for sustainable products from various retailers (Amazon, OTTO, Zalando) and provides up-to-date information about the products. The database was built during the first phase of the GCA project, long before this study began. Because some of the online retailers do not always provide credible sustainability labels for the products they offer, we also run an ML-based service in addition to the GreenDB to increase the number of sustainable products. These components together – Ecosia’s shopping vertical, the GreenDB, and the additional ML-based service – constitute the software examined in this study.
The software currently provides automated sustainable product recommendations for 19 different product categories, covering fashion and electronics products. In this study, we focus on the smartphone product category, the most-searched-for electronic product in Ecosia’s shopping vertical. Furthermore, although previous studies have found that smartphones are responsible for more GHG emissions than other devices (e.g., laptops), more sustainable smartphone consumption (e.g., extending the replacement cycle) has the potential to reduce annual GHG emissions in the European market by up to 14.12 tons of (EEB, 2019). Thus, when earlier studies in the GCA research project defined a set of criteria that a smartphone must meet to be considered more sustainable, criteria that indicate a smartphone’s potential to last longer (e.g., easy repair) were used as key indicators (Hoffmann, 2022).
However, to quantify the effects of sustainable product recommendations, both user purchasing decisions and the software’s emissions should be considered. Given previous findings indicating that sustainable purchasing behavior can be influenced (Cochoy et al., 2017; Frick et al., 2019; Fuentes & Sörum, 2019), this study conducts a detailed step-by-step analysis to evaluate the emissions associated with the energy required to compute automated sustainable shopping recommendations, as well as potential system-level impacts by evaluating the indirect effects of influenced consumption decisions and their embodied CO2 e emissions. We aim to assess the system-level impacts of the GCA’s sustainable shopping recommendations and relate them to direct computing-related emissions caused during the development, execution, and usage of the software. Hence, this study considers emissions caused during the software’s development, execution, and usage and compares them to estimates of the software’s contribution to emissions avoidance. This leads to the following research questions (RQ):
RQ1: What is the computing-related GWP of the GCA’s automated sustainable shopping recommendations, and how does this compare to the potential indirect emissions avoidance?
RQ2: Which steps in the software system have the greatest potential to further reduce the software’s GWP?
4 Methodology
For this interdisciplinary study, we adopt a life-cycle perspective, guided by the standard ISO LCA 14040 / 44 (DIN EN ISO 14044, 2006). To obtain the needed inventory data, we use various methods and tools, from carbon footprint measurements for ML models to consumer behavior research and secondary data from published LCAs. In this chapter, we describe our methodological approach, including our measurement setup and system boundaries.
The impact of ML-based software can be assessed by measuring direct and indirect emissions. Direct emissions, also referred to as computing-related emissions, include embodied emissions, which describe emissions related to hardware production. This also includes emissions resulting from dynamic power consumption, which includes the active processes, that is, when the software is being executed continuously and the hardware is actively used. Finally, emissions resulting from idle power consumption – which refers to when the hardware is switched on (i.e., powered up) but is not actively being used by the software, as is the case when the hardware is cooling down (Luccioni et al., 2022) – are also considered as direct emissions. To assess our software’s direct emissions, we only measure dynamic power consumption, which only includes instances where all steps are being actively executed. Section 4.1 further describes the scope of our measurement. Note that we have decided not to assess embodied emissions due to a lack of available data.
To estimate the impact on overall GHG emissions associated with displaying automated sustainable smartphone recommendations in Ecosia’s shopping vertical over the course of a year, we observe three main tasks. First, we assess the GHG emissions caused by the development, execution, and use of the recommendations. Second, we assess the potentially avoided GHG emissions resulting from consumer behavior influenced by sustainable product recommendations. Third, we compare and evaluate both outcomes.
4.1 Use Case Description and Scope Definition
The purpose of the software is to recommend four sustainable5 smartphones to users of Ecosia’s shopping vertical over the span of one year (365 days). According to the ISO standard for conducting LCAs, 14044:2006, a functional unit must be defined. The functional unit is the quantified performance of a product system for use as a reference unit (DIN EN ISO 14044, 2006). To assess our software’s GWP, we define the following functional unit: Computation of four automated sustainable smartphone recommendations daily over a 365-day period (1,460 total recommendations).
The software assessed in this study comprises several components required to enable automated sustainable product recommendations. Collecting the required components – which all require energy flows to perform their respective tasks – is in the following also referred to as the assessed software, with the components referred to as “steps.” Running our assessed software then means running its steps once, weekly, or daily depending on the unique step requirement. For this study, we assess the energy flows that enter our assessed software and their respective GHG emissions. To estimate the related computing emissions caused by running our assessed software, we measure the energy consumed (kWh) at each step. Figure 2 visualizes the assessed software and the life-cycle phases considered. Unlike cradle-to-grave LCAs, we focus on the energy-intensive parts of the software development and execution, in particular, the ML training and usage phase of the software. The embodied emissions, that is, emissions caused during the hardware’s life cycle, preceding components are excluded from this study due to a lack of available data. Also, the software development costs related to implementing components not related to ML training are excluded because they incur negligible costs compared to the energy demands of the software execution and ML model training.
Figure 2: Included and excluded life-cycle phases and data sources.
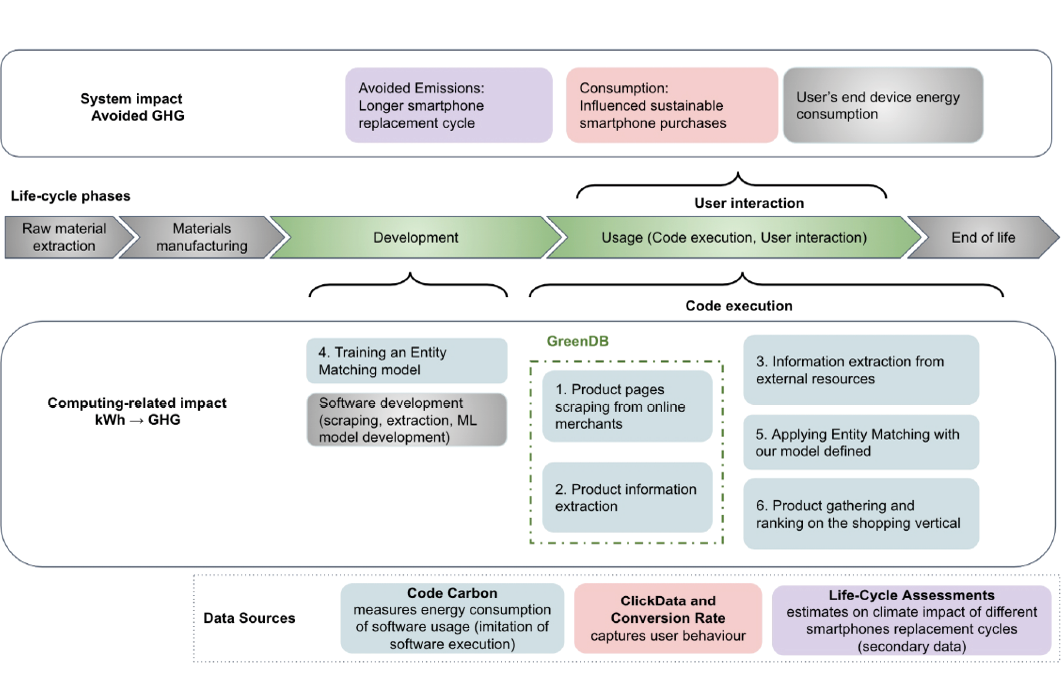
All steps 1 – 6 outlined in Figure 2 contribute to the final computing-related GHG emissions, and their energy consumption is estimated using the CodeCarbon software package (green boxes). The user behavior associated with consumption is measured by the Click Data (pink boxes), and the longer smartphone replacement cycle estimates obtained from published LCAs (purple boxes) contribute to the system-level impacts (i.e., avoided GHG emissions). The foundation is the GreenDB created in steps 1 and 2, which involves scraping product pages from various online retailers (step 1) and extracting product information (step 2), including sustainability certificates. Although all historical products are stored in GreenDB, we only use the latest weekly scraped products for sustainable product recommendations because some products might become outdated, unavailable, or receive a different price over time.
However, some retailers do not always provide sustainability information about their sustainable products. To address this, we introduce an additional step (step 5) that matches the products in our GreenDB with external resources (websites, such as iFixit6, TCO7, and French Repairability Index8) that provide sustainability information for electronic products. To extract the information of interest from these resources, we apply step 3, which sees us extract product information. To match products from external resources to our GreenDB, we finetune an already pre-trained multilingual Sentence Transformer 9 (step 4) on the Product Data Corpus and Gold Standard for Large-Scale Product Matching, a publicly available dataset from Web Data Commons (WDC)10. We train the model for three epochs, using the default parameters for the optimizer. The model is then used in step 5 – as a service after weekly product extraction – to match the products without sustainability information with the external resources data (extracted in step 3). As a final step, we evaluate products based on their sustainability information, classify them into different groups depending on the product category, rank them based on their sustainability score, and filter the top ten products per category (step 6). Four of the top-ranked products in each product category appear in Ecosia’s Shopping Vertical with a simple sustainability label.
Table 1: Steps in our software’s life cycle, including their occurrence frequency, goal, and reference name.
|
Step |
Occurrence |
What is done |
Referred to as |
|
1 |
Once |
Product pages scraped from online retailers |
GreenDB |
|
2 |
Once |
Product information extraction |
GreenDB |
|
3 |
Once |
Information extraction from external resources |
External Certificates |
|
4 |
Once |
Training our entity matching model |
EM Training |
|
5 |
Weekly |
Applying entity matching with the model trained in step 4 |
Entity Matching (EM) |
|
6 |
Daily |
Product gathering and ranking on the shopping vertical |
Ecosia display |
Cut-off criteria
Due to the scope of the study and data availability, we do not consider adopting several possible steps:
- Establishing and maintaining the GreenDB and establishing the entity matching training and inference code: This step is excluded because the process happened in an earlier phase of the project (i.e., before this study was conducted).
- Retrieving the external resources in step 3: The external resources were downloaded from the internet, a step not measured in code.
- Maintaining the software: Maintenance is harder to estimate because it can involve different machines, and maintenance tasks can vary from minutes to days.
- Establishing and maintaining the entire shopping vertical: We do not have access to this part of the system because it takes place on Ecosia’s side.
- Energy consumption by the user: We do not measure this because we do not have access to users’ device information.
Listing 1: Our cluster and local system specifications.
CLUSTER NODE
OS Linux-5.4.0-81-generic-x86_64-with-glibc2.31
Python Version 3.10.8
CPU 128 x AMD EPYC 7502 32-Core Processor
GPU 1 x NVIDIA A100-PCIE-40GB
LOCAL MACHINE
OS macOS-12.6-x86_64-i386-64bit
Python Version 3.10.9
CPU 2 x Intel(R) Core(TM) i7-9750H CPU @ 2.60GHz
Measurement setup
Every step except step 4 is performed on a local machine. We have chosen our local machine for its more isolated environment, recognizing that the estimates on our cluster nodes may be confounded with other workloads running on the same physical node.
Steps 1 and 2 are conducted on our self-hosted Kubernetes cluster at BHT in Berlin, Germany. However, measuring the total impact on our cluster would be more complicated because it involves several services running together. Therefore, we deployed the entire scraping and extraction pipeline on a local machine to measure its impact. For step 1, we use Scrapy11, an open-source Python framework for extracting data from websites; for step 2, we use Extruct12, a Python library for extracting data from HTML markup. The software is completely written in Python. We store the final data in a Postgresql13 database. Step 6 is run daily by Ecosia. Because we do not have access to this step of the assessed software, we simulate this step on our local machine in Berlin and measure the estimates accordingly. In step 4, we finetune a pre-trained model on a cloud computer, with the cluster node specifications given in Listing 1. For the training component, we use an isolated node, meaning a node not shared with other users but with some cluster-related background processes. Step 5 includes inference on the EM model and is executed on the cluster once a week after finishing scraping and extraction.
4.2 Computing-Related Impact: Approach, Tools, and Resources
For this study, we attempt to estimate the energy used in the form of kWh for as many steps as possible and translate those to GHG emissions. For those steps for which we cannot produce estimates due to lack of access, data availability, or time, we use estimates based on published research. Furthermore, we assume that the user looks for products on the Ecosia shopping vertical independently of the sustainable shopping recommendations. Therefore, we only consider the emissions that are caused by the automated sustainable smartphone recommendations.
Regarding the choice of a tool for calculating the CO2 e for all steps, among the libraries listed in Chapter 2, CodeCarbon is one of the newest and best-maintained open-source libraries (Selvan et al., 2022). Based on its popularity and following the common practice of choosing a well-maintained software and tool, we use CodeCarbon to measure the energy consumed at each step of our assessed software. The tool provides separate measurements for CPU and GPU. For the CPU estimates on Linux, it uses rapl; on Mac and Windows, it uses Intel Power Gadget for CPU estimates and pynvml for GPU estimates. However, for the final CO2 e estimates, we only use the power consumption (P) estimates of the computing infrastructure, given in kilowatt-hours (kWh). The relationship between P and reported CO2 e emissions is modeled as:
CO2 e = P * 485 g/kWh (Eq. 1)
To determine the associated GHG emissions, we use the values for the carbon intensity of the German energy mix for the year 2021, listed in Eq. 1. We use data from the German Federal Environment Agency, which estimates the CO2 emission factor 14 of German electricity consumption considering upstream emissions (Icha & Lauf, 2022). We do not use an emission factor that considers the carbon intensity of the actual energy mix used by GCA. To obtain the final estimates, we apply CodeCarbon to subsets of data and then scale the numbers according to the average number of products we use weekly or daily in the smartphone category. For the steps that are measured on a local machine, CodeCarbon uses its fallback mode with an approximation by retrieving the thermal design power (TDP) for our hardware from a database15. The specifications for the local machine appear in Listing 1.
To estimate steps 1 and 2 (GreenDB), we measure the energy required for a sample of 130 product pages and then scale these estimates to 700 products, the weekly average number of scraped smartphones. These two steps are measured together because the two services in our GreenDB pipeline are always run together. For steps 3 and 4, we run CodeCarbon over the original code and data used in our assessed software. In steps 5 and 6, we estimate the energy for 700 products, the weekly average number of products in the smartphone category. All weekly and daily estimates are finally scaled by the number of repetitions, that is, 52 and 365. The final energy consumption estimates are reported on an annual basis, and we estimate an annual average of 36,400 scraped smartphones.
4.3 System-Level Impacts: Avoided GHG Emissions
To estimate the potential GHG emissions that could be avoided due to sustainable smartphone recommendations, we draw upon existing behavioral research, actual click data for sustainable products recommended by the GCA, and published smartphone LCAs. The estimate of avoided emissions (A) is summarized by the following formula:
A=P*S (Eq. 2)
A = Avoided emissions (range in CO2 e)
P = Number of purchased sustainable smartphones
S = CO2e of unsustainable smartphones – CO2 e of sustainable smartphones (range of avoided CO2 e)
We do not have data regarding the purchased sustainable and unsustainable smartphones from Ecosia’s shopping vertical. To address this data gap, we treat our sustainable product recommendations similarly to ads appearing in the context of comparable online search engines and use published secondary data about how successfully those ads convert user behaviors, that is, the CVR. Irvine (2021) observed an average CVR of 1.91 % for Google Shopping ads and 1.74 % for Bing Shopping ads. Based on those findings, we assume a CVR of ~0.018 (~1.8 %) for sustainable product recommendations on Ecosia. To obtain an estimate of the number of sustainable smartphone purchases (P) influenced by our software, we multiply the CVR by measured click-throughs. Because our functional unit evaluates the impact of sustainable smartphone recommendations over the course of a year, we multiply the number of click-throughs by three because the data provided spans only 4 months. This is summarized by the following formula:
P (Number of purchased sustainable smartphones) = CVR x Click Throughs (Eq.3)
Finally, we need to estimate the GHG emissions that can be avoided if a purchase decision is made against a non-recommended smartphone and for a sustainable recommended alternative (S). However, the software constantly changes its smartphone recommendations during the period studied, based on weekly calculated sustainability stores (Step 6). Additionally, we have no information about the smartphones (and their emissions) that the user actually purchased or would have instead if the feature (i.e., sustainable product recommendations) had not been added to the shopping vertical.
Nonetheless, as Chapter 3 describes, the main criterion for recommending sustainable smartphones is their assumed longer lifespan based on defined criteria, such as high repairability scores from recognized repairability indices (Hoffmann, 2022). Therefore, we focus here on the common factor of longer lifespan of recommended smartphones compared to non-recommended smartphones. We use secondary data from published LCAs and comparisons of LCAs that evaluate how emissions from smartphones change when their replacement cycle is extended under different scenarios. We search the Web of Science and Google Scholar for relevant studies. To be considered, studies have to be open access, written in English, and not published before 2018 (due to the rapid evolution of smartphone technology). We evaluate multiple studies, selecting scenarios that quantify avoided carbon emissions due to an extended smartphone replacement cycle from two to three years to up to five years through various design (e.g., modular design), use, or repair scenarios. We apply these estimates to our smartphones with similar sustainability characteristics with emissions for a replacement cycle of up to five years. We do not assert that these studies and their respective scenarios represent an exhaustive list.
We identify a total of 12 lifespan extension scenarios from four different studies (Cordella et al., 2021; Pamminger et al., 2021; Sánchez et al., 2022; Schneider et al., 2018), with details presented in the Appendix (Table A1). The scenarios capture different approaches and consider the effect on different smartphones in regard to how extending the average replacement cycle from two to three years to up to five years could reduce GHG emissions due to repairability or modular design and how these different characteristics may impact the overall CO2 e of the smartphone during its life cycle. Due to the different study designs, methods, and scenarios evaluated, the identified LCAs cannot be compared directly. Hence, the goal of this approach is not to compare the twelve scenarios but to identify a range of estimates from which to derive the magnitude of potentially avoided emissions. The studies differ, as do the recommended sustainable smartphones and their potentially unsustainable alternatives. Estimated emissions avoided by longer lifespans ranged from 14.97 kg CO2 e to 34.4 kg CO2 e.
Finally, we add the measured and retrieved data into the equations to obtain the quantified direct and indirect GHG emission data associated with the life cycle of our software and its different steps.
5 Results
This study reports several outputs that we quantify as GWP, measured in terms of kg CO2 e. In this chapter, we first present the results for the measured energy consumption and the consequent CO2 e emissions of all steps included in our assessed software (steps 1 – 6 in Figure 2). Then, we present the range of potential GHG emissions avoidance associated with extended smartphone lifespans (drawn from existing studies), followed by a comparison of both emissions ranges, from which we derive the estimated net GWP of GCAs for sustainable smartphone recommendations over the one-year period.
5.1 Computing-Related GWP of GCAs Sustainable Smartphone Recommendations
Table 2 shows the measured kWh for all steps and the consequent CO2 e emissions. For a more accurate estimate, we conducted our experiments ten times and obtained a range of energy consumptions per step rather than just focusing on point estimates from CodeCarbon. Of the six steps of our assessed software, the weekly scraping of products and extraction of product information (GreenDB; step 1 and 2) require the largest amount of energy, followed by EM training. The total estimated GWP associated with running the software ranges between 1.282 kg CO2 e and 1.289 kg CO2 e.
Table 2: The annual climate impact of each step of the assessed software.
|
Step |
kWh (Median) |
kWh |
kg CO2 e |
|
1/2. GreenDB |
1.515 |
1.514 / 1.517 |
0.734 / 0.736 |
|
3. External certificates |
0.00001 |
0.000010 / 0.000012 |
0.000005 / 0.000006 |
|
4. EM Training |
1.029 |
1.027v1.031 |
0.498 / 0.5 |
|
5. EM |
0.090 |
0.081 / 0.096 |
0.039 / 0.046 |
|
6. Ecosia’s reranking |
0.019 |
0.018/0.019 |
0.009/0.01 |
|
Total |
2.653 |
2.643 / 2.658 |
1.282 / 1.289 |
5.2 System-Level Impacts
Sustainable smartphone recommendations were displayed on 28,287 Ecosia Shopping searches between June 1 and September 30, 2022. Of those impressions, 694 received click-throughs. The sustainable smartphone recommendations over the course of a year resulted in 2082 clicks on sustainable smartphones. With an average CVR of ~1.8 %, we would expect to trigger ~37 sustainable smartphone purchases that otherwise would not have happened. The ratio of the scenarios was multiplied by the factor for estimated influenced consumption decisions (Appendix), enabling us to obtain a ratio for the estimated impact of potentially avoided emissions by influencing consumers to purchase smartphones with higher repairability. Multiplied by the potential avoided emissions retrieved from the LCA studies – all ranging between 14.97 kg CO2 e and 34.4 kg CO2 e – we calculate a potential to avoid between 553.89 and 1272.8 kg CO2 e annually by recommending sustainable smartphones.
5.3 Net GWP Estimates
As with the actual CO2 e emissions generated by our system, we also provide a range of figures for the reduced CO2 e emissions from the estimated purchase of 37 more sustainable smartphones over the course of one year.
Figure 3: Annual range estimate of the amount of CO₂ caused by our assessed software system (1.282–1.289 kg), and the amount of CO₂e (553.89–1272.8 kg) avoided by influencing consumer behavior.
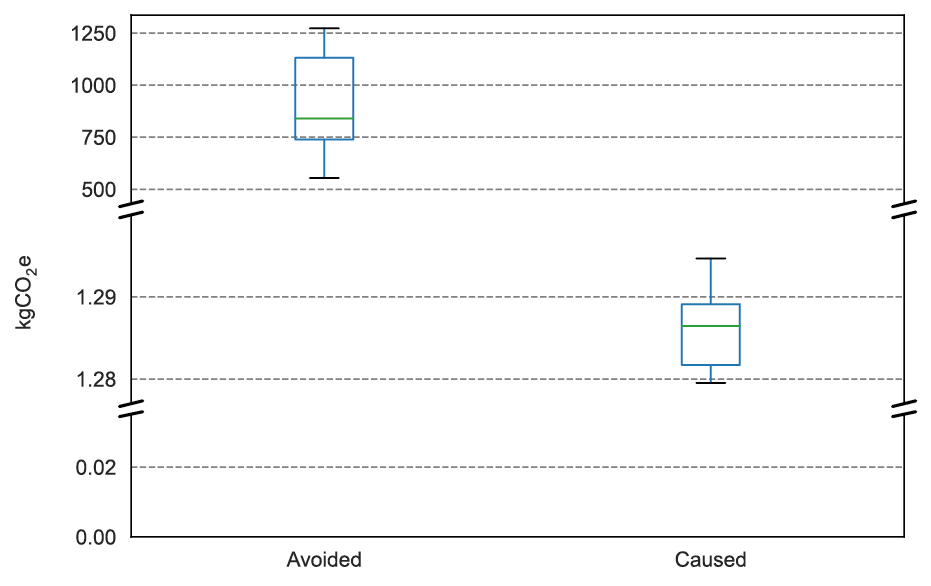
As Figure 3 shows, the annual emissions generated by the software range from 1.282 to 1.289 kg CO2 e and are lower than the estimated emissions that could be avoided by encouraging the purchase of sustainable smartphones, which range from 553.89 to 1272.8 kg CO2 e. Even the lowest estimate of emissions avoided is 553.89 kg CO2 e, which is about 429 times higher than the highest estimate of total emissions caused by the development, execution, and use of the software. Furthermore, influencing just one consumer to buy a more sustainable smartphone outweighs the GWP of the whole production system.
6 Discussion
This study has investigated the direct GHG emissions associated with the use of a particular software and its components, measuring and comparing the calculations to estimates of GHG emissions potentially avoided due to the indirect system-level impacts of the software. This chapter first discusses the results and associated limitations of the computing-related emissions measured before discussing the same for the assessed system-level indirect emissions and, finally, highlighting further research avenues.
6.1 Computing-Related Impacts
The total GWP associated with running the sustainable smartphone recommendations, as an additional feature for Ecosia’s shopping vertical, ranges between 1.282 kg CO2 e and 1.289 kg CO2 e. However, a lack of available data and the scope of this study means we have excluded several steps. Unlike Wu et al. (2022), we have not included emissions generated from the production of hardware used, which limits the completeness of our emissions measurements. If these were added, emissions from software would likely increase. In contrast to Kern et al. (2018), we also have not accounted for the potential additional impacts associated with maintaining the software. Instead, we have focused on the dynamic time of the hardware, that is, we do not consider idle time, cooling of the system, or production of the hardware itself. Furthermore, we have only simulated some processes, and we have not measured them on the original computers on which they were used. Therefore, the actual direct emissions caused by the software’s life cycle are likely higher than estimates. Further research should consider more phases of the product life cycle and investigate steps taking place during the production and use phases.
The step associated with the most emissions is the GreenDB, the weekly scraping of products and extraction of product information, which consumes between 1.514 and 1.517 kWh (0.734 and 0.736 kg CO2 e) annually. A simple approach to reducing its impact would be to reduce the annual number of scrapings and repeat them, for example, every 10 days, instead of weekly. This would reduce energy consumption by almost 30 %. However, this could lead to more outdated product information (i.e., prices and availability). Our redundant weekly product scraping and extraction steps, where we scrape the same products repeatedly to maintain up-to-date product information, lead to the trade-off between having an up-to-date product database and reducing the impact on GHG emissions. Therefore, we aim to provide an optimized solution that sees only part of the product information updated for existing products in our database. This approach, where only partial information is updated, might be a better solution in the long run, both for the time needed to perform the GreenDB step and for the environmental impact in general.
With an estimated GHG value between 0.498 and 0.5 kg CO2 e, training the EM model is the step representing the second-largest volume of GHG emissions. Due to the nature of EM training, we did not break down the indirect emissions caused by training the EM model across all 19 product categories. To achieve the required results, the EM needed to be trained on all 19 product categories, but it could potentially be used for even more categories. Therefore, we decided against allocating associated emissions to specific categories. For further research, it would be of interest to expand the assessed system and conduct this approach for all product categories currently offered by the software. In this way, the impact of the trained EM model remains the same in the other categories, meaning it has less impact on the assessment. Additionally, in line with Santarius et al. (2022), software products should avoid data transfers that are not necessary for a service to provide its intended functionality. For our case, provided the primary product information from retailers does not contain information regarding their reparability, using the EM approach continues to be required, despite its emissions cost.
Although we used an LLM for our EM, we aimed to reduce the energy demands by not performing hyperparameter optimization and used the default hyperparameters proposed by Lacoste et al. (2019), Patterson et al. (2021), and Wu et al. (2022). We have also provided transparent information about our results, hardware, location, and overall methodology. However, for the EM, we could have used a simpler model instead of an LLM. If there is a reasonable trade-off between GHG emissions and the high performance of the model, this can significantly reduce the software’s overall GHG emissions. Another approach would be to choose a cloud region with a lower carbon intensity when performing hardware-intensive operations, as done in one study in the context of AWS16, Azure17, and GCP18 in Quebec, Canada (Henderson et al., 2022). Furthermore, during the EM model prototyping process, additional computing-related emissions have not been accounted for. This process requires additional work that may involve training and comparing multiple candidate models that do not necessarily meet the final system design requirements at this stage, nor can they be selected as the final model (Schelter et al., 2015). Thus far, we have only recognized this in the work of Wu et al. (2022), who recognize that they spend 10 % of their energy on experimentation in their AI infrastructure processes.
Another factor that highly influences computing-related impacts – in particular, the emissions caused by dynamic power consumption – is the energy mix. We have derived the GHG emissions factor from the German energy mix for 2021 as published by the German Federal Environment Agency (Icha & Lauf, 2022). Using the same system run in, for example, France – which has recorded lower carbon intensity of ~56 g CO2 e / kwh (Henderson et al., 2022) – would significantly lower emissions. According to a 2030 scenario commissioned by the German Federal Environment Agency, which evaluates instruments to achieve the German climate protection target of 65 % of GHG emissions by 2030, emissions from the German energy mix could decrease to 81.8 g CO2 / kwh by 2030 by increasing the share of renewables (Repenning et al., 2023). This, in turn, would lead to a reduction in the computing-related emissions of our software.
6.2 System-Level Impacts
With an estimated impact of 37 influenced smartphone purchase decisions over the course of one year, the impact of automated sustainable product recommendations on sustainable purchase decisions is rather small. However, this could be partly due to the way that recommendations are visualized in Ecosia’s shopping vertical (see Figure 1). In the current version, users are only shown a portion of the products classified as sustainable, and the sustainability information is reduced to the simple statement “sustainable.” This deprives users of detailed information about production processes and product characteristics (information asymmetry) (Gossen et al., 2022). This limits the relevance and practicability of the recommendations, potentially explaining the low click rates. Furthermore, previous research has shown that behavior is not based purely on rational arguments and objective information. Instead, every consumption decision can also contain social and emotional elements. That is, people do not always consciously think about their actions and decisions, nor do they always have access to all the information they need to do so (Klein & O’Brien, 2018). Future research should obtain more accurate information about the number of actually influenced consumption decisions associated with the GCA’s sustainable shopping recommendations. It is also important to stress that every product – even the most “sustainable“ choice – produces emissions, which suggests that the most sustainable recommendation would be no consumption at all. Additionally, other aspects that affect the lifespan of the product – such as usage behavior and user interests – have not been considered, nor have possible rebound effects of sustainable smartphone recommendations been assessed. This suggests that it might be promising to complement the GCA with sufficiency-oriented consumption recommendations (Gossen et al., 2023) and to evaluate possible additional emissions due to rebound effects in future studies.
Another important limitation relates to the estimates used to quantify the assumed avoided emissions. The estimation of potentially avoided emissions ranges from 553.89 to 1272.8 kg CO2 e. We have not been able to obtain data concerning the actual consumption decisions made or the differences in emissions between the smartphones actually purchased and the smartphones consumers would have purchased in the absence of sustainable product recommendations. Because of these limitations, considerable uncertainty looms behind the assumed positive effects. Nonetheless, the calculations provide a first estimate of the potential impact of the recommendations. Future research would need to further develop this approach. We recognize that a direct comparison between the different LCAs used to assess different scenarios for different smartphones and under different assumptions about potential pathways to extend their replacement cycle is not possible due to the different methodologies used. However, we consider that using them as an indicator of a potential range of avoided emissions represents a useful first step towards quantifying the potential indirect system impact of the software. Additionally, the results can provide an overview of the range of CO2 e potentially avoided by promoting products with higher repairability and, thus, potentially longer lifespans. These assumptions also align with the European Commission’s recent proposal regarding the “Right to Repair.” That proposal aims to promote repair as a more sustainable consumption option that contributes to climate and environmental goals under the European Green Deal (European Commission, 2023).
Because the software is currently being developed for 18 product categories other than smartphones, it would be promising to repeat this study for other product categories, especially given that product categories (e.g., T-shirts) may have lower emissions savings potential than smartphones.
Broadly, this study’s findings recognize the potential to directly and indirectly avoid GHG emissions by presenting sustainable shopping recommendations as an additional feature for a shopping vertical. However, assessing these direct and indirect emissions is based on many assumptions, rendering the study subject to limitations due to the system boundaries we have defined and the data sources we have used.
7 Conclusion
This study has combined and tested different tools and methods to measure the net impact of software leveraging state-of-the-art ML technology to foster more sustainable shopping behavior. In contrast to previous studies that have investigated the GHG emissions of singular ML components, we have evaluated the net effect of sustainable shopping recommendations in a detailed step-by-step manner in a real-world application.
Our study’s main contributions are twofold. First, our approach shows how existing methodologies and tools can be combined to assess the direct and indirect impacts of novel emerging energy-intense ML software components. Future studies can use this approach as an example of measuring such a system, even with limited data and under limited system conditions, and of gathering quantified impact data. Second, we have conducted an empirical study in an example application, the GCA, deployed in the context of the search engine Ecosia. Our results demonstrate that the net effect of sustainable shopping recommendations can be positive, despite the use of modern ML technology. These findings demonstrate that software can indirectly contribute to reducing global GHG emissions if designed carefully. However, we have also found that quantifying the GHG emissions caused by the software is measurable to some extent, while the assumed impact on sustainable consumption is based on a broader range of estimates based on mostly secondary data sources (due to not having access to actual data). Notably, conducting our own LCA for each recommended smartphone was outside of the scope of our study. Nonetheless, assessing the environmental impact of the development of software and ML tools and the integration of environmental aspects early in the design process represents an important contribution on its own. Because all measured GHG emissions result from the software’s energy consumption of the source, the same assessed software powered by a different energy mix could cause very different GHG emissions.
We encountered many methodological challenges in assessing the climate impact of ML-based software and collecting the necessary data, in part due to the lack of established standards. Therefore, it is essential for policymakers and researchers to contribute to creating standards for assessing the carbon footprint of software products. Our study’s results show that the software has the potential to indirectly avoid more emissions than it causes, with changes along different steps of the software potentially amplifying this.
References
Anthony, L. F. W., Kanding, B., & Selvan, R. (2020). Carbontracker: Tracking and Predicting the Carbon Footprint of Training Deep Learning Models (arXiv:2007.03051). arXiv. http://arxiv.org/abs/2007.03051
Amodei, D., & Hernandez, D. (2018, May 16). AI and compute. OpenAI. https://openai.com/blog/ai-and-compute/
Andrae, A. S. G., & Edler, T. (2015). On global electricity usage of communication technology: Trends to 2030. Challenges, 6(1), 117 – 157.
https://doi.org/10.3390/challe6010117
Arushanyan, Y., Ekener-Petersen, E., & Finnveden, G. (2014). Lessons learned – Review of LCAs for ICT products and services. Computers in Industry, 65(2), 211 – 234. https://doi.org/10.1016/j.compind.2013.10.003
Arvesen, A., Bright, R. M., & Hertwich, E. G. (2011). Considering only first-order effects? How simplifications lead to unrealistic technology optimism in climate change mitigation. Energy Policy, 39(11), 7448 – 7454. https://doi.org/10.1016/j.enpol.2011.09.013
Bannour, N., Ghannay, S., Névéol, A., & Ligozat, A.-L. (2021). Evaluating the carbon footprint of NLP methods: A survey and analysis of existing tools. Proceedings of the Second Workshop on Simple and Efficient Natural Language Processing, 11 – 21. https://doi.org/10.18653/v1/2021.sustainlp-1.2
Bastida, L., Cohen, J. J., Kollmann, A., Moya, A., & Reichl, J. (2019). Exploring the role of ICT on household behavioural energy efficiency to mitigate global warming. Renewable and Sustainable Energy Reviews, 103, 455 – 462. https://doi.org/10.1016/j.rser.2019.01.004
Belkhir, L., & Elmeligi, A. (2018). Assessing ICT global emissions footprint: Trends to 2040 & recommendations. Journal of Cleaner Production, 177, 448 – 463. https://doi.org/10.1016/j.jclepro.2017.12.239
Bender, E. M., Gebru, T., McMillan-Major, A., & Shmitchell, S. (2021). On the dangers of stochastic parrots: Can language models be too big? Proceedings of the 2021 ACM Conference on Fairness, Accountability, and Transparency, 610 – 623. https://doi.org/10.1145/3442188.3445922
Budennyy, S., Lazarev, V., Zakharenko, N., Korovin, A., Plosskaya, O., Dimitrov, D., Arkhipkin, V., Oseledets, I., Barsola, I., Egorov, I., Kosterina, A., & Zhukov, L. (2022). Eco2AI: Carbon emissions tracking of machine learning models as the first step towards sustainable AI. arXiv. http://arxiv.org/abs/2208.00406
Chen, Y. (2022). Analysis on the impact of recommender systems on consumer decision: Making on China’s online shopping platforms. 2022 6th International Conference on E-Commerce, E-Business and E-Government, 272 – 276. https://doi.org/10.1145/3537693.3537734
Clément, L.-P. P.-V. P., Jacquemotte, Q. E. S., & Hilty, L. M. (2020). Sources of variation in life cycle assessments of smartphones and tablet computers. Environmental Impact Assessment Review, 84(106416).
https://doi.org/10.1016/j.eiar.2020.106416
Cochoy, F., Hagberg, J., Petersson McIntyre, M., & Sörum, N. (Eds.). (2017). Digitalizing consumption: How devices shape consumer culture. Routledge. https://doi.org/10.4324/9781315647883
Cordella, M., Alfieri, F., & Sanfelix, J. (2021). Reducing the carbon footprint of ICT products through material efficiency strategies: A life cycle analysis of smartphones. Journal of Industrial Ecology, 25(2), 448 – 464. https://doi.org/10.1111/jiec.13119
EEB. (2019). Coolproducts don’t cost the earth – Full report.
https://eeb.org/library/coolproducts-report/
European Commission. (2022, May 18). 5 digital solutions for a greener Europe. https://joint-research-centre.ec.europa.eu/jrc-news-and-updates/5-digital-solutions-greener-europe-2022-07-05_en
European Commission. (2023, March 22). Right to repair: Commission introduces new consumer rights for easy and attractive repairs [Press release]. https://ec.europa.eu/commission/presscorner/detail/en/ip_23_1794
Fleder, D., Hosanagar, K., & Buja, A. (2010). Recommender systems and their effects on consumers: The fragmentation debate. Proceedings of the 11th ACM Conference on Electronic Commerce, 229 – 230.
https://doi.org/10.1145/1807342.1807378
Freitag, C., Berners-Lee, M., Widdicks, K., Knowles, B., Blair, G. S., & Friday, A. (2021). The real climate and transformative impact of ICT: A critique of estimates, trends, and regulations. Patterns, 2(9), 100340. https://doi.org/10.1016/j.patter.2021.100340
Frick, V., Jaeger-Erben, M., & Hipp, T. (2019). The “making” of product lifetime: The role of consumer practices and perceptions for longevity. PLATE, Berlin.
Fuentes, C., & Sörum, N. (2019). Agencing ethical consumers: Smartphone apps and the socio-material reconfiguration of everyday life. Consumption Markets & Culture, 22(2), 131 – 156. https://doi.org/10.1080/10253866.2018.1456428
GeSI. (2015). #SMARTer2030 – ICT Solutions for 21st Century Challenges. https://smarter2030.gesi.org/downloads/Full_report.pdf
Gossen, M., Hoffmann, M. L., & Güldenpenning, N. (2022). Glaubwürdige und leicht verfügbare Nachhaltigkeitsinformationen bei der Internetsuche auf Ecosia. Der grüne Konsumassistent als Lösungsansatz für die Informationskomplexität nachhaltiger Konsumentscheidungen. In M. Schlaile & L. F. Stöber (Eds.), Consumer Social Responsibility im digitalen Raum: Entscheidungsarchitekturen, geteilte Verantwortung und Handlungsspielräume (pp. 121 – 140). Metropolis-Verlag.
Gossen, M., Tröger, J., Veneny, M., Eichhorn, H., & Bergener, J. (2023). Do people make sufficiency-oriented mobile phone choices based on dynamic norms? The perception and effectiveness of sufficiency-promoting messages in online media. Frontiers in Sustainability, 4, 1145243.
https://doi.org/10.3389/frsus.2023.1145243
Gröger, J., Köhler, A., Naumann, S., Filler, A., Guldner, A., Kern, E., Hilty, L. M., & Maksimov, Y. (2018). Entwicklung und Anwendung von Bewertungsgrundlagen für ressourceneffiziente Software unter Berücksichtigung bestehender Methodik (105/2018). Umweltbundesamt.
https://www.umweltbundesamt.de/sites/default/files/medien/1410/publikationen/2018-12-12_texte_105-2018_ressourceneffiziente-software_0.pdf
Henderson, P., Hu, J., Romoff, J., Brunskill, E., Jurafsky, D., & Pineau, J. (2022). Towards the systematic reporting of the energy and carbon footprints of machine learning. arXiv. http://arxiv.org/abs/2002.05651
Hoffmann, M. L. (2022). Working paper: Nachhaltige Produktempfehlungen – Identifizierung und Bewertung nachhaltiger Produkte.
https://green-consumption-assistant.de/wp-content/uploads/Working-Paper_Nachhaltige-Produktempfehlungen-im-GCA_20221219.pdf
Hoosain, M. S., Paul, B. S., Kass, S., & Ramakrishna, S. (2023). Tools towards the sustainability and circularity of data centers. Circular Economy and Sustainability, 3(1), 173 – 197. https://doi.org/10.1007/s43615-022-00191-9
Horner, N. C., Shehabi, A., & Azevedo, I. L. (2016). Known unknowns: Indirect energy effects of information and communication technology. Environmental Research Letters, 11(10), 103001.
https://doi.org/10.1088/1748-9326/11/10/103001
Icha, P., & Lauf, T. (2022). Entwicklung der spezifischen Treibhausgas-Emissionen des deutschen Strommix in den Jahren 1990 – 2021 (15/2022; Climate Change). Umweltbundesamt. https://www.umweltbundesamt.de/sites/default/files/medien/1410/publikationen/2022-04-13_cc_15-2022_strommix_2022_fin_bf.pdf
IPCC. (2022). Climate Change 2022: Mitigation of Climate Change. Summary for Policy Makers. https://www.ipcc.ch/report/ar6/wg3/downloads/report/IPCC_AR6_WGIII_SPM.pdf
Irvine, M. (2021). Google Shopping Ads Benchmarks: Average CPC, CTR, Monthly Budget, & More. https://www.wordstream.com/blog/ws/2019/04/01/shopping-ads-benchmarks
Environmental management – Life cycle assessment – Requirements and guidelines (ISO 14044:2006), (2006). https://doi.org/10.31030/2761237
Itten, R., Hischier, R., Andrae, A. S. G., Bieser, J. C. T., Cabernard, L., Falke, A., Ferreboeuf, H., Hilty, L. M., Keller, R. L., Lees-Perasso, E., Preist, C., & Stucki, M. (2020). Digital transformation – Life cycle assessment of digital services, multifunctional devices and cloud computing. The International Journal of Life Cycle Assessment. https://doi.org/10.1007/s11367-020-01801-0
Jäckle, S. (2021). Reducing the carbon footprint of academic conferences by online participation: The case of the 2020 Virtual European Consortium for Political Research General Conference. PS: Political Science & Politics, 54(3), 456 – 461. https://doi.org/10.1017/S1049096521000020
Jäger, S., Greene, J., Jakob, M., Korenke, R., Santarius, T., & Biessmann, F. (2022). GreenDB: Toward a product-by-product sustainability database. arXiv. http://arxiv.org/abs/2205.02908
Kaack, L. H., Donti, P. L., Strubell, E., Kamiya, G., Creutzig, F., & Rolnick, D. (2022). Aligning artificial intelligence with climate change mitigation. Nature Climate Change, 12(6), 518 – 527. https://doi.org/10.1038/s41558-022-01377-7
Kern, E., Hilty, L. M., Guldner, A., Maksimov, Y. V., Filler, A., Gröger, J., & Naumann, S. (2018). Sustainable software products – Towards assessment criteria for resource and energy efficiency. Future Generation Computer Systems, 86, 199 – 210. https://doi.org/10.1016/j.future.2018.02.044
Klein, N., & O’Brien, E. (2018). People use less information than they think to make up their minds. Proceedings of the National Academy of Sciences, 115(52), 13222 – 13227. https://doi.org/10.1073/pnas.1805327115
Köhler, S., Herzog, B., Honig, T., Wenzel, L., Plauth, M., Nolte, J., Polze, A., & Schroder-Preikschat, W. (2020). Pinpoint the joules: Unifying runtime-support for energy measurements on heterogeneous systems.
Lacoste, A., Luccioni, A., Schmidt, V., & Dandres, T. (2019). Quantifying the carbon emissions of machine learning. arXiv. http://arxiv.org/abs/1910.09700
Lange, S., Pohl, J., & Santarius, T. (2020). Digitalization and energy consumption. Does ICT reduce energy demand? Ecological Economics, 176, 106760. https://doi.org/10.1016/j.ecolecon.2020.106760
Lannelongue, L., Grealey, J., & Inouye, M. (2021). Green Algorithms: Quantifying the Carbon Footprint of Computation. Advanced Science, 8(12), 2100707. https://doi.org/10.1002/advs.202100707
Lehmann, C. (2021). Scaling sustainability advice – Options for generating large-scale green consumption recommendations [Working Paper].
Luccioni, A. S., Viguier, S., & Ligozat, A.-L. (2022). Estimating the carbon footprint of BLOOM, a 176B parameter language model. arXiv.
http://arxiv.org/abs/2211.02001
Malmodin, J. (2020). The power consumption of mobile and fixed network data services – The case of streaming video and downloading large files. International Congress “Electronics Goes Green 2020+”. Proceedings: The Story of Daisy, Alexa and Greta, September 1, 2020, Berlin, Germany, Virtual, 10.
Mickoleit, A. (2010). Greener and Smarter: ICTs, the environment and climate change (OECD Green Growth Papers 2010/01). OECD.
https://doi.org/10.1787/5k9h3635kdbt-en
Pamminger, R., Glaser, S., & Wimmer, W. (2021). Modelling of different circular end-of-use scenarios for smartphones. The International Journal of Life Cycle Assessment, 26(3), 470 – 482. https://doi.org/10.1007/s11367-021-01869-2
Patterson, D., Gonzalez, J., Holzle, U., Le, Q., Liang, C., Munguia, L.-M., Rothchild, D., So, D. R., Texier, M., & Dean, J. (2022). The carbon footprint of machine learning training will plateau, then shrink. Computer, 55(7), 18 – 28. https://doi.org/10.1109/MC.2022.3148714
Patterson, D., Gonzalez, J., Le, Q., Liang, C., Munguia, L.-M., Rothchild, D., So, D., Texier, M., & Dean, J. (2021). Carbon emissions and large neural network training. arXiv. https://doi.org/10.48550/ARXIV.2104.10350
Pohl, J., Hilty, L. M., & Finkbeiner, M. (2019). How LCA contributes to the environmental assessment of higher order effects of ICT application: A review of different approaches. Journal of Cleaner Production, 219, 698 – 712. https://doi.org/10.1016/j.jclepro.2019.02.018
Repenning, J., Harthan, R., Bürger, V., Cook, V., Emele, L., Göckeler, K., Görz, W. K., Hacker, F., Hennenberg, K., Jörß, W., Kasten, P., Kreye, K., Ludig, S., Matthes, F. C., Moosmann, L., Nissen, C., Reise, J., Scheffler, M., Schumacher, K., … Steinbach, J. (2023). Klimaschutzinstrumente-Szenario 2030 (KIS-2030) zur Erreichung der Klimaschutzziele 2030 (30/2023). Umweltbundesamt. https://www.umweltbundesamt.de/publikationen/klimaschutzinstrumente-szenario-2030-kis-2030-zur
Rolnick, D., Donti, P. L., Kaack, L. H., Kochanski, K., Lacoste, A., Sankaran, K., Ross, A. S., Milojevic-Dupont, N., Jaques, N., Waldman-Brown, A., Luccioni, A. S., Maharaj, T., Sherwin, E. D., Mukkavilli, S. K., Kording, K. P., Gomes, C. P., Ng, A. Y., Hassabis, D., Platt, J. C., … Bengio, Y. (2023). Tackling climate change with machine learning. ACM Computing Surveys, 55(2), 1 – 96. https://doi.org/10.1145/3485128
Sánchez, D., Proske, M., & Baur, S.-J. (2022). Life Cycle Assessment of the Fairphone 4. Fraunhofer IZM. https://www.fairphone.com/wp-content/uploads/2022/07/Fairphone-4-Life-Cycle-Assessment-22.pdf
Santarius, T., Bieser, J. C. T., Frick, V., Höjer, M., Gossen, M., Hilty, L. M., Kern, E., Pohl, J., Rohde, F., & Lange, S. (2022). Digital sufficiency: Conceptual considerations for ICTs on a finite planet. Annals of Telecommunications. https://doi.org/10.1007/s12243-022-00914-x
Schelter, S., Biessmann, F., Januschowski, T., Salinas, D., Seufert, S., & Szarvas, G. (2015). On challenges in machine learning model management. https://assets.amazon.science/7d/38/968b82c745bd9859a79dab0aade8/on-challenges-in-machine-learning-model-management.pdf
Schneider, A. F., Matinfar, S., Martino Grua, E., Casado-Mansilla, D., & Cordewener, L. (2018). Towards a sustainable business model for smartphones: Combining product-service systems with modularity. 82 – 63. https://doi.org/10.29007/djcz
Schulte, P., Welsch, H., & Rexhäuser, S. (2016). ICT and the demand for energy: Evidence from OECD countries. Environmental and Resource Economics, 63(1), 119 – 146. https://doi.org/10.1007/s10640-014-9844-2
Selvan, R., Bhagwat, N., Anthony, L. F. W., Kanding, B., & Dam, E. B. (2022). Carbon footprint of selecting and training deep learning models for medical image analysis (Vol. 13435, pp. 506 – 516). https://doi.org/10.1007/978-3-031-16443-9_49
Strubell, E., Ganesh, A., & McCallum, A. (2019). Energy and policy considerations for deep learning in NLP (The 57th Annual Meeting of the Association for Computational Linguistics (ACL), p. 6). https://doi.org/10.48550/arxiv.1906.02243
Touvron, H., Lavril, T., Izacard, G., Martinet, X., Lachaux, M.-A., Lacroix, T., Rozière, B., Goyal, N., Hambro, E., Azhar, F., Rodriguez, A., Joulin, A., Grave, E., & Lample, G. (2023). LLaMA: Open and efficient foundation language models. arXiv. http://arxiv.org/abs/2302.13971
Wu, C.-J., Raghavendra, R., Gupta, U., Acun, B., Ardalani, N., Maeng, K., Chang, G., Behram, F. A., Huang, J., Bai, C., Gschwind, M., Gupta, A., Ott, M., Melnikov, A., Candido, S., Brooks, D., Chauhan, G., Lee, B., Lee, H.-H. S., Hazelwood, K. (2022). Sustainable AI: Environmental implications, challenges and opportunities. http://arxiv.org/abs/2111.00364
Zhang, K., Li, S., Qin, P., & Wang, B. (2022). Spatial and temporal effects of digital technology development on carbon emissions: Evidence from China. Sustainability, 15(1), 485. https://doi.org/10.3390/su15010485
Appendix
Table A1: Avoided GHG emission estimates from existing research for the extension of smartphone lifespans.
|
Source |
Baseline scenario |
Lifespan extension scenario |
Difference in life-cycle emissions in kg of CO2 (avoided emissions) |
|
Schneider et al., 2018 |
Non-modular smartphone with repairs, lifespan of 5 years |
Modular smartphone with repairs, lifespan of 5 years |
14.97 |
|
Cordella et al. |
2-year replacement cycle over a period of 4.5 years |
3-year replacement cycle, with |
17.7 |
|
Cordella et al., 2021 |
2-year replacement cycle over a period of 4.5 years |
3-year replacement cycle, with |
18.1 |
|
Sánchez et al., |
3-year replacement cycle over a period of 5 years, without repair |
5-year replacement cycle, with repair |
20.6 |
|
Sánchez et al., |
3-year replacement cycle over a period of 5 years, without repair |
5-year replacement cycle, without repair |
22.3 |
|
Cordella et al., 2021 |
2-year replacement cycle over a period of 4.5 years |
3-year replacement cycle over a period of 4.5 years, with battery change |
22.5 |
|
Cordella et al., 2021 |
2-year replacement cycle over a period of 4.5 years |
3-year replacement cycle over a period of 4.5 years |
22.9 |
|
Pamminger et al., 2021 |
2,5-year replacement cycle without repair |
Smartphones with repair (repair success rate of 75%) and an average second use time of 1.56 years |
24.6 |
|
Cordella et al., 2021 |
2-year replacement cycle over a period of 4.5 years |
4-year replacement cycle over a period of 4.5 years, with battery and display change |
30.5 |
|
Cordella et al., 2021 |
2-year replacement cycle over a period of 4.5 years |
4-year replacement cycle over a period of 4.5 years, with display change |
30.8 |
|
Cordella et al., 2021 |
2-year replacement cycle over a period of 4.5 years |
4-year replacement cycle over a period of 4.5 years, with battery change |
34.1 |
|
Cordella et al., 2021 |
2-year replacement cycle over a period of 4.5 years |
4-year replacement cycle over a period of 4.5 years |
34.4 |
Table A2: The assessed software steps and the explanation about what is done, which data are used, what is excluded, what are the limitations, and where these steps are measured.
|
Scraping - GreenDB (1) |
Extraction - GreenDB (2) |
External Information (3) |
EM Training (4) |
EM (5) |
Ecosia’s Reranking (6) |
|
|
What is done? |
Web retailers scraping |
Extraction of the web data in 1 |
Extraction of external label resources |
Training an SBERT model on WDC |
Application of the resources from 4 to the data from 2 |
Ranking of the top N products (smartphones) based on the data 5 and 2 |
|
Tools |
Python; Scrapy |
Python; Extruct; Postgresql |
Extruct |
HuggingFace; Pytorch |
Python |
Python |
|
Data |
Smartphone websites from Amazon, OTTO |
Scraped websites in 1 |
IFIXIT; TCO; French Repairability Index |
WDC Products data |
The data output from 2 and 3 |
The unified data output from 2 and 5 |
|
What is |
Set-Up; Maintenance |
Set-Up; Maintenance |
Set-Up; Maintenance Data Retrieval |
Set-Up; Maintenance |
Set-Up; Maintenance |
Set-Up; Maintenance |
|
Limitation |
Not measuring the actual deployed code, but instead a local version |
Not measuring the actual deployed code, but instead a local version |
Not measuring the actual deployed code, but instead a local version |
Not measuring the actual deployed code, but instead a local version |
Not measuring the actual deployed code, but instead a local version |
|
|
Measuring Location |
Local machine |
Local machine |
Local machine |
Cluster |
Local machine |
Local machine |
Declaration of competing interests
The authors declare no competing interests.
Acknowledgements
This research was funded by the Federal Ministry for the Environment, Nature Conservation, Nuclear Safety and Consumer Protection (FKZ 67KI2022).
Date received: May 2023
Date accepted: January 2024
1 Ecosia is a search engine owned by Ecosia GmbH, headquartered in Berlin, Germany.
5 Within the GCA’s green shopping recommendations, smartphones are evaluated for their sustainability based on a set of criteria. The primary criterion for recommending sustainable smartphones is their potentially longer lifespan, which can be improved by improved repairability. Further information about the approach is described in the working paper by Hoffmann (2022).
14 The emission factor is derived from the German energy mix and is only a hypothetical factor used for this study. In reality, all functions performed by the GCA that require energy on Ecosia’s side use only energy from renewable sources and therefore have a lower emission factor.