
Multidimensional Digital Inequalities
Theoretical Framework, Empirical Investigation, and Policy Implications of Digital Inequalities among Older Adults
1 Introduction
As the diffusion of the Internet has progressed, the focus of research on digital inequalities has shifted from mere access to frequency of use, users’ skills, diversity of use, and finally, the benefits of Internet use. Given the sequential order of academic research phases, these dimensions of inequalities are often referred to as first-level (i.e., having access to the Internet or not; NTIA, 1995), second-level (i.e., skills, frequency of use, and use of different services including content production; Bonfadelli, 2002; Hargittai, 2002), and third-level inequalities (i.e., tangible outcomes such as economic, cultural, social, and personal participation; Scheerder, van Deursen, & van Dijk, 2017; van Deursen & Helsper, 2015, 2017). Despite early calls to explore and clarify the relationships between the different dimensions of inequality (Selwyn, 2004), only a small number of theoretical contributions (De Haan & Iedema, 2006; Helsper, 2012) and empirical studies have addressed this topic explicitly (Tirado-Morueta, Mendoza-Zambrano, Aguaded-Gómez, & Marín-Gutiérrez, 2017; van Deursen, Helsper, Eynon, & van Dijk, 2017; van Deursen & van Dijk, 2015). Hereby, the conception of a sequential digital exclusion (van Deursen et al., 2017) prevails and is theoretically informed by the idea of a digital reproduction of inequality (Hargittai, 2008; Kvasny, 2006). According to this perspective, a set of personal and positional categorical inequalities in society systematically disadvantages certain people on different dimensions of Internet use and, therewith, related outcomes such as social, cultural, economic, and political participation (Helsper, 2012). For example, education, gender, age, and income were repeatedly found to explain inequalities regarding access, diversity of use, skills, and outcomes (Hargittai, 2002; NTIA, 1995; Wei, 2012; Xie, 2011). However, dependencies within a specific dimension (van Deursen et al., 2017) and crosscutting effects between the various dimensions (de Haan & Idema, 2006) demonstrate the need to relax a purely sequential perspective and to take relationships between the various dimensions of digital inequality into account. In this article, we argue that the theoretical assumption of sequential digital inequality is only one of four possible relationships that need be distinguished when considering multiple dimensions, and we propose a systematic typology of multidimensional relationships. Based on combinatorial logic, we propose a differentiation among maintaining, reinforcing, mitigating, and modifying relationships between different dimensions of digital inequality.
The relevancy of our systematic typology for a multi-level perspective on digital inequality becomes most apparent in contexts in which the first- and second-level divides have not yet been closed. This is known to be the case for specific geographic regions (Baller, Dutta, & Lanvin, 2016) but also for specific sociodemographic groups such as older adults (Hunsaker & Hargittai, 2018). Furthermore, the continuous innovation of devices and services may result in a renaissance of inequalities in dimensions that were assumed to have vanished (e.g., access to mobile broadband as a new type of access divide). This may become especially critical in exceptional situations such as the lockdown during the Covid-19 pandemic (Seifert, Cotton, & Xie, 2021).
This article focuses on the Internet use of older adults for four reasons. First, older adults represent a societal group of substantial size that is growing faster than all other age groups (United Nations, 2017). Second, digital inequality is especially pronounced in this age group. While a major share is still offline or in the process of appropriation, others are as avid users as the younger generations (Hargittai & Dobransky, 2017; Nimrod, 2016; Quan-Haase, Martin, & Schreuers, 2016). This is related to a third argument, namely that older adulthood includes a very diverse set of life situations that need to be taken into consideration (from recent retirement to being care-dependent), resulting in very diverse reasons for not using the Internet (Friemel, 2016). Fourth, appropriate Internet use by older adults provides the potential to overcome possible inequalities rooted in age-related limitations, such as physical mobility (König, Seifert, & Doh, 2018). In sum, it is of special societal relevance to advance the current discussion on digital inequality with a focus on older adults and from a multidimensional perspective. We draw on a representative study of adults above 65 years of age in Switzerland to investigate the factors related to inequalities in this age group (RQ1) and the proposed relationships between the dimensions of inequality (RQ2). Hereby, we distinguish between access, frequency of use, skills, diversity of use, and outcomes. The hypothesized relations with the individual context (gender, age, education, income, and preretirement PC use) and the social context (relationship status, frequency of use by friends and family, and encouragement by friends and family) are largely supported. Furthermore, empirical evidence is found for all four proposed relationships. Besides the contribution of the systematic typology to the theoretical discussion, the empirical findings are discussed with respect to future research and policy interventions.
1.1 Hierarchical and non-hierarchical models of digital inequality
In order to avoid confusion with established terms regarding the research phases mentioned above, we speak of dimensions of digital inequality instead of levels. Furthermore, this wording helps to overcome the implicit presupposition of a sequential digital exclusion. In a multidimensional setting, a sequential model assumes a specific hierarchical order of the dimensions, which implies that an inequality found on the first dimension has a causal impact on all subsequent dimensions (Tirado-Morueta et al., 2017; Wei, Teo, Chan, & Tan, 2011). However, the validity of a hierarchical model can be challenged by two theoretical arguments. First, the assumed sequence may loop several times, as proposed by the cumulative and recursive model (van Dijk, 2005). Second, crosscutting relationships between the various dimensions (de Haan & Iedema, 2006) suggest a model in which several dimensions are influential in parallel (Helsper, 2012; van Deursen & van Dijk, 2015).
Given that most empirical studies on digital inequality rely on cross-sectional data, we propose a critical assessment of assumptions of causal effects between the dimensions and a limitation of the hierarchical order to relationships where plausible theoretical assumptions can be made justifying the respective order. For example, frequency of use is logically dependent on having Internet access. However, skills may not only be the outcome of more frequent use but also a motivation to use the Internet more often. Following this reasoning, a mix of hierarchical and non-hierarchical relationships may be necessary in a multidimensional model of digital inequality.
2 A systematic typology of relationships in a multidimensional model of digital inequality
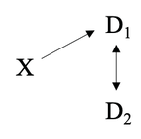
Based on the assumption that digital inequality is not only dependent on various factors such as gender, age, education, or income but also on other dimensions of Internet use (e.g., the achievement of preferable outcomes can be related with skills), we differentiate four relationships between the dimensions. We refer to these as maintaining, reinforcing, mitigating, and modifying relationships. This typology of four relationships results when two dimensions (D1 and D2) and up to two influential factors (X and Y), as well as the sign of their influence (positive, negative, or absent), are considered (Table 1). If no sign is mentioned, it does not affect the substantial interpretation of the relationship.
Van Deursen, Helsper, Eynon, and van Dijk (2017) proposed the term sequential digital exclusion when inequalities span multiple dimensions (e.g., motivation, access, skills, use). In order to overcome the related hierarchical perspective, we suggest calling this a maintaining relationship between different dimensions of inequality. This means that an inequality found on one dimension is maintained on other dimensions without presupposing a specific sequential order. For example, if income is found to be related with having Internet access and having Internet access is found to be related with having specific ICT skills, these skills are unequally distributed across income groups. In an empirical model, this can be accounted for by controlling for direct effects between the dimensions (Tirado-Morueta et al., 2017; van Deursen et al., 2017; van Deursen & van Dijk, 2015).
Table 1: Relationships Between Dimensions of Inequality
|
Relationship |
Description of the setting |
Graphical representation |
|
Maintaining |
Due to a relationship between two dimensions (D1 and D2 ), a factor’s effect (X) in one dimension (e.g., having Internet access) has an indirect impact on another dimension (e.g., skills). An inequality created in one dimension is therefore maintained across dimensions. |
|
|
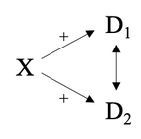
Reinforcing |
Due to a relationship between two dimensions (D1 and D2 ) and a factor’s effect (X) in the same direction in both dimensions, each inequality is reinforced by the other. An inequality found in one dimension may therefore be more pronounced when additional dimensions are considered. |
|
|
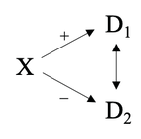
Mitigating |
Due to a relationship between two dimensions (D1 and D2 ) and a factor’s effect (X) in the opposite direction in the two dimensions, inequality in one dimension is mitigated by the other. An inequality found in one dimension may therefore be of less relevance when additional dimensions are considered. |
|
|
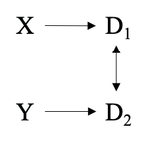
Modifying |
Due to a relationship between two dimensions (D1 and D2 ) and the effects of two factors (X and Y) in both dimensions, each inequality is modified by the other. An inequality found in one dimension may therefore only reveal a partial view on a more complex situation. |
|
In addition to these maintaining relationships, empirical studies found direct effects of demographics in multiple dimensions. Specifically, age was found to have an independent effect on skills, use, and outcomes. The effects were negative across all domains, indicating that older Internet users have fewer skills, lower usage, and poorer outcomes in terms of economic, cultural, social, and personal participation (van Deursen et al., 2017; van Deursen & van Dijk, 2015). These findings suggest that the inequalities are not only maintained but may also be amplified across the various dimensions. Hence, inequalities found on a single dimension may easily be underestimated and require a multidimensional perspective to be captured in their entirety. We suggest calling this a reinforcing relationship to emphasize that an existing inequality is magnified by the inclusion of the additional dimension. Empirically, a reinforcing relationship is present if a factor has a significant effect in the same direction in two correlated dimensions.
The logical counterpart to the above setting would be present when there is a significant correlation between two dimensions and a factor has significant effects but in an opposite direction. Due to the relationship between the dimensions, inequalities are diminished in the aggregate. For example, women might be advantaged in one dimension and disadvantaged in another dimension, resulting in a reduction in the overall gender inequality. In case of a positive correlation between the dimensions, both inequalities are kept within certain bounds. We suggest calling this a mitigating relationship because an existing inequality is reduced if the other dimension is considered.
While the three relationships described above deal with a single influencing factor in multiple dimensions, one must also consider the relevant interactions of various factors across different dimensions. Therefore, we suggest accounting for modifying relationships that are given when a factor modifies an inequality that is related to another factor on another dimension. Based on the abovementioned findings, age and gender could have a modifying relationship. If age is found to cause inequalities regarding access and gender is found to cause inequalities regarding skills, each has a modifying effect on the other factor. In this example, this results in at least four groups (i.e., younger females, older females, younger males, older males) with potentially distinct characteristics of Internet use. Of course, this logic is not limited to two factors and therefore may require multivariate approaches to be analyzed. Studies that focus on one dimension can account for modifying relationships by considering interaction effects between the factors. However, if multiple dimensions are taken into account, this relationship might easily be overlooked.
In sum, we argue that inequalities in a specific dimension may be maintained in another dimension, reinforced or mitigated by the same influential factors, or modified by additional factors. This typology extends and differentiates the idea of a sequential digital exclusion proposed by van Deursen et al. (2017). It is important to note that the proposed typology is compatible with hierarchical, non-hierarchical, and mixed models of multidimensional digital inequalities. To our knowledge, only a few studies have taken the relationships between multiple inequality dimensions into account (Tirado-Morueta et al., 2017; van Deursen et al., 2017; van Deursen & van Dijk, 2015; Wei et al., 2011). This may be because some of the basic inequalities (e.g., access) have been considered closed in most settings. Studying Internet use in Ecuador, which still has limited Internet access (Baller, Dutta, & Lanvin, 2016), is one of the rare exceptions covering a longer cascade from pure access to skills and the use of specific content (Tirado-Morueta et al., 2017). However, this study follows a strict sequential perspective and does not distinguish between different relationships.
3 Older European adults’ Internet use
Internet use by older adults still lags behind the average adoption rate. While 89% of Europeans aged 25 to 64 years had used the Internet within the previous three months, the share among 65-to-74-year-olds is only 56% (Eurostat, 2019). This gap has received increasing scholarly attention in recent years (Friemel, 2016; Hargittai & Dobransky, 2017; Hunsaker & Hargittai, 2018; König, Seifert, & Doh, 2018; Lengsfeld, 2011; Nimrod, 2016; Olson, O’Brien, Rogers, & Charness, 2011; Quan-Haase, Martin, & Schreuers, 2016) and has revealed two sets of factors that are repeatedly found to be related with this inequality.
The first set of factors relate to the individual. Older women use the Internet less often than men of the same age (Fernstrom et al., 2011; Helsper, 2010; Korupp & Szydlik, 2005). Age is found to have a negative influence on Internet use within the group of older adults as well. This can be explained by increasing health issues such as visual, acoustic, and tactile limitations (Dobransky & Hargittai, 2006). Less educated people are less likely to use the Internet compared to those with more education (Jung et al., 2010; König, Seifert, & Doh, 2018; Norris, 2001; Warschauer, 2003), and individuals’ financial resources also shape how they use the Internet: Those with financial restrictions are less likely to be Internet users (Bonfadelli, 2002; Compaine, 2001; Lengsfeld, 2011). Moreover, technical experience (such as acquiring computer literacy and dealing with modern technologies during one’s work life) is an important prerequisite and ultimately has a positive effect on Internet acceptance (Friemel, 2016; van Deursen & van Dijk, 2011).
A second set of factors relate to the social context (Antonnuci, Ajrouch, & Manalel, 2017). This begins with the life situation (e.g., relationship status) but also includes social support by others (Hunsaker et al., 2019). People are more likely to use the Internet when they live with a partner, have friends and family who use the Internet, or are encouraged by them to use the Internet (Friemel, 2016; König, Seifert, & Doh, 2018). Besides providing support for Internet use, the facilitation of maintaining social relationships is found to be an important motivation and ultimately a key benefit of Internet use (Hunsaker et al., 2019; Nimrod, 2010; Sum, Mathews, Pourghasem, & Hughes, 2008).
4 Research questions and hypotheses
The aim of this article is to investigate digital inequalities among older adults through the use of a multidimensional approach and to gain insight into the relationships between five dimensions in which digital inequality can emerge: access, frequency of use, skills, diversity of use, and benefits. In a descriptive first step, we identify the relevant factors related with inequalities in each dimension. We include the individual context (age, gender, income, education, etc.) and the social context (Internet use of friends and family, encouragement by friends and family, etc.). Thus, the first research question is: (RQ1) What are the relevant factors of the individual and social contexts for digital inequalities among older adults with respect to access, frequency of use, skills, diversity of use, and benefits? Based on the literature, we assume higher levels of access, frequency, skills, diversity, and benefits for those with the following characteristics: male gender (H1), younger age (H2), higher education (H3), higher income (H4), preretirement PC use (H5), living in a relationship (H6), having a higher frequency of Internet use in the social context (H7), and being encouraged by the social context (H8).
In a second step, we address the research question regarding the relationships among the various inequality dimensions that may lead to maintaining, reinforcing, mitigating, or modifying effects between the dimensions. Specifying these relationships is of interest because they provide insight into the potential impact of different intervention strategies aimed at decreasing inequalities. Thus, the second research question is as follows: (RQ2) How do the identified factors maintain, reinforce, mitigate, or modify the digital inequality across multiple dimensions?
5.1 Data
Based on longitudinal studies, the Internet use of older adults increases only at a slow pace. For the age group 70 and above, official statistics from Switzerland reported a share of 42% weekly users in 2015 (the time of data collection) and 24% in 2018 (BFS, 2020). Hence, the phenomenon is rather stable, and the findings reported in this study are still relevant for today’s situation. A random sample of Swiss residents aged ≥ 65 years, with no restrictions on upper age, current Internet use, or type of housing, was selected from a database that is based on postal addresses and phone book entries of Switzerland. All participants were informed and invited in advance by a written postal letter from the research team. Data were collected by computer-assisted telephone interviews and paper-and-pencil surveys of households without a telephone connection. This fieldwork was conducted by an established survey company. The response rate was 43% and resulted in a sample of 1,037 persons. All participants provided verbal informed consent and the study was conducted according to the guidelines of the Ethics Committee of the University of Zurich. Participants were not compensated in any way for participating. The study included a good representation across all age groups ≥ 65 years and had only a small underrepresentation of those ≥ 90 years old (M = 75.1; SD = 7.46).
5.2 Measures
Dimensions of Internet use
We included five dimensions of Internet use that are adapted from a longitudinal study on older adults’ Internet use in Switzerland (Seifert & Schelling, 2015). Access was measured by querying whether the participants had ever used the Internet. The proportion of 57.7% of older adults with online access provided a rare opportunity to study inequalities of access in relation to other inequalities. Second, those who had used the Internet before were asked how often they had used it within the previous six months. This frequency of use was measured on an ordinal scale with four intensity levels. Respondents who used the Internet daily or several times a week were considered frequent users (79.4% of those with access), and those who used it less frequently (i.e., several times per month or less) were regarded as light users. This dichotomization was owed to the ordinal scale of the answer options. Third, to gather information about perceived Internet skills, participants were asked to estimate their Internet knowledge on a labeled 5-point scale ranging from “I have no knowledge about the Internet” to “I’m an Internet expert” (M = 3.0; SD = 0.83). Fourth, diversity of use was measured with a list of 13 different types of content and services that had been used within the previous three months. We combined these 13 items in a sum index (M = 6.7; SD = 3.09). Fifth, potential benefits were measured by querying whether the respondent agreed or disagreed with three statements that have been found to be important benefits for older adults: “The Internet allows me to stay independent longer into old age,” “The use of the Internet gives me more security in life,” and “The use of the Internet gives me more freedom in organizing my own life” (5-point scale ranging from fully disagree to fully agree). For the analysis, the mean of the three items was calculated (M = 2.7; SD = 1.20), as the internal consistency turned out to be good (α = .819).
Beside frequency of Internet use we also collected information regarding the use of specific Internet services. Hereby we focused on four fields that are relevant for both offline and online exclusion (i.e., economic, cultural, social, and personal resources; Helsper, 2012). Participants were asked if they had used the respective services within the previous three months. This includes the use of the Internet to send and receive emails, look for health-related information, look up e-government information, use e-commerce (buy and sell goods or use e-banking), access classic mass media content (journals, radio, videos, or digital TV), or for the respondent’s own mobility (schedules, travel, or navigation).
Individual context
Education was measured by the highest academic degree (general education, apprenticeship, higher education, and university or university of applied science). Income was measured as the income of all household members in Swiss francs per month (M = 5,282; SD = 2,835). Preretirement computer use was assessed by asking whether a computer had been often, seldom, or not at all used before retirement. For the analysis, the variable was dichotomized into a dummy variable for those who had used a computer before retirement (59.6%).
Social context
Relationship status was measured by whether the respondents were unmarried, married or in a partnership, widowed, or divorced or living separately. This measure was dichotomized to depict the existence of a current partnership (58.7%) or the lack thereof. Frequency of use by friends and family quantified on a 5-point scale (ranging from 1 = not at all to 5 = very intense) how intensely the Internet was used by the respondent’s same-aged social network (i.e., partners, siblings, and friends). The maximum value of the three items was used as an indicator for frequency of use by at least one person in the respondent’s social network (M = 3.7; SD = 1.27). Internet use by children and grandchildren was not considered for this measure because they had little variance and would instead be indicators of the existence of children and grandchildren and not the frequency of their Internet use. The encouragement by friends and family to use the Internet was calculated as the mean for all friends and family (i.e., partners, siblings, friends, children, and grandchildren). Encouragement was measured on a 5-point scale (ranging from 1 = advice not to use the Internet to 5 = advice to use the Internet) and combined in a mean index (M = 3.6; SD = 1.16; α = .852).
5.3 Analysis
Multivariate logistic regressions were applied for the dichotomous dependent variables (Internet access, frequency of use, and the use of specific types of content), and Nagelkerke’s r2 was used to estimate the variance explained by the models. For the analysis of the metric variables (skills, diversity of use, and benefits), multivariate linear regressions and the corrected r2 were calculated. Regarding the dimensions’ skills, diversity of use, and benefits, only respondents with Internet access were taken into account in the regression models. This is owed to the filter logic of the survey as no data regarding these dimensions were collected for those not using the Internet at all.
6 Results
In order to answer RQ1 regarding the relevant factors related to digital inequalities among older adults with respect to access, frequency of use, skills, diversity of use, and benefits, we regressed these dimension on the variables of the individual and social contexts. The respective logistic and linear regressions are reported in Table 2 in separate columns. Further statistics are provided in the appendix (zero-order correlations in Table 4 and effects sizes in Table 5 and 6). The presentation of the results focuses on each model sequentially, summarizing the relevant (i.e., significant) factors for each dimension. Since the hypothesized influence of a factor is the same for all dimensions, the support for the respective hypothesis can easily be checked by comparing the sign indicated next to the hypothesis (e.g., H1-: negative) with the sign and significance level (p) of the reported estimate (b). In addition to the independent variables of the individual and social context, the model context includes the measures of the other dimensions of digital inequality, which allows the investigation of the relationships between the dimensions (RQ2).
Increasing age (H2) decreases the probability of having Internet access, while higher education (H3) and higher income (H4) increase the probability of having Internet access. Furthermore, Internet access is more likely if respondents had used a computer before retirement (H5) and if their friends and family encourage them to use the Internet (H8).
The dependent variable of frequency of use distinguished those who use the Internet at least several times a week from those with less frequent use. Here, gender (H1) predicts frequency of use in the sense that women are less likely to belong to the group of frequent users, and increasing age (H2) decreases the probability of belonging to the group of frequent users. With respect to the model context, higher diversity of use is positively associated with higher probability of belonging to the group of frequent users.
Gender (H1) significantly predicts Internet skills, indicating lower skills for women. Furthermore, preretirement computer use (H5) and encouragement by friends and family (H8) are related to higher values in Internet skills. Within the model context, both the diversity of use and benefits are positively related with Internet skills.
Regarding diversity of use, measured by the number of different types of content and services used by older adults, age (H2) was found as a predictor as well. Increasing age is related to a less diverse use of the Internet. Preretirement computer use (H5), on the other hand, has a positive effect and leads to more diverse Internet usage. Diversity of use is also found to be higher for those whose friends and family use the Internet more frequently (H7). Positive relationships between the dimensions were found with frequency of use and skills.
Significant predictors related to more obtained benefits of Internet use are the frequency of Internet use in the respondent’s social context (H7), encouragement by friends and family (H8), and the respondent’s own skills.
To examine the use of different types of content and services among older adults more closely, the same factors as in the previous models were used to explain the use of six selected topics measured on a dichotomous scale. Table 3 therefore includes six logistic regression models for the use of the Internet to send and receive emails, look for health-related information, look up e-government information, use e-commerce, access classic mass-media content, or use the Internet for the respondent’s own mobility.
Table 2: Logistic and Linear Regressions for Digital Inequalities in Multiple Dimensions
|
Access |
Frequency |
Skills |
Diversity |
Benefits |
|||||||
|
b(SE) |
b(SE) |
b(SE) |
b(SE) |
b(SE) |
|||||||
|
Individual context |
Gender (H1-) |
−0.46 (0.25) |
−1.13 (0.42) |
** |
−0.14 (0.07) |
* |
−0.22 (0.29) |
−0.09 (0.12) |
|||
|
Age (H2-) |
−0.11 (0.02) |
*** |
−0.09 (0.03) |
** |
0.01 (0.01) |
−0.07 (0.03) |
** |
0.02 (0.01) |
|||
|
Education (H3+) |
0.46 (0.13) |
*** |
−0.03 (0.20) |
0.04 (0.03) |
0.06 (0.14) |
0.06 (0.06) |
|||||
|
Income (H4+) |
0.21 (0.06) |
*** |
−0.02 (0.07) |
0.01 (0.01) |
0.06 (0.05) |
0.02 (0.02) |
|||||
|
Preretirement |
1.45 (0.23) |
*** |
−0.06 (0.42) |
0.35 (0.09) |
*** |
0.83 (0.39) |
* |
−0.07 (0.16) |
|||
|
Social context |
Relationship status (H6+) |
0.01 (0.26) |
0.21 (0.43) |
−0.06 (0.07) |
−0.34 (0.31) |
−0.16 (0.13) |
|||||
|
Frequency of use |
0.03 (0.10) |
−0.37 (0.19) |
0.01 (0.03) |
0.34 (0.14) |
* |
0.13 (0.06) |
* |
||||
|
Encouragement |
0.76 (0.12) |
*** |
0.16 (0.21) |
0.08 (0.04) |
* |
0.11 (0.17) |
0.34 (0.07) |
*** |
|||
|
Model context |
Frequency of use by ego |
0.18 (0.10) |
3.46 (0.39) |
*** |
0.17 (0.17) |
||||||
|
Skills |
0.40 (0.29) |
1.49 (0.20) |
*** |
0.25 (0.09) |
** |
||||||
|
Diversity of use |
0.60 (0.08) |
*** |
0.08 (0.01) |
*** |
0.03 (0.02) |
||||||
|
Benefits |
0.26 (0.17) |
0.08 (0.03) |
** |
0.15 (0.12) |
|||||||
|
Constant |
3.90 (1.61) |
* |
5.46 (2.85) |
0.90 (0.50) |
2.65 (2.20) |
−1.47 (0.9) |
|||||
|
N |
692 |
462 |
422 |
422 |
422 |
||||||
|
Nagelkerke’s R2 /R2 corr |
.552 |
.552 |
.365 |
.449 |
.190 |
||||||
|
Correct |
82.1% |
89.1% |
|||||||||
*p < .05 **p < .01 ***p < .001; f&f: friends and family
We found that gender has different effects depending on the type of content. Women are more likely to use the Internet to search for health-related information but less likely to use it for e-commerce. Age only predicts the use of e-commerce in the sense that older respondents are less likely to use the Internet for that purpose. Education is positively associated with the use of e-government information, so better-educated respondents are more likely to look up this type of content on the Internet. Higher income, on the other hand, is positively related with the probability of the use of email and e-commerce. The frequency of Internet use by friends and family is positively associated with the use of email and Internet use regarding mobility. Encouragement in the social environment is positively related with the probability of the use of online media. Finally, skills and frequency of use consistently predicted the use of all types of content.
Table 3: Logistic Regressions for Specific Types of Content
|
|
Health information |
E-government information |
E-commerce |
Mobility |
Media |
||||||||
|
b(SE) |
b(SE) |
b(SE) |
b(SE) |
b(SE) |
b(SE) |
||||||||
|
Individual context |
Gender |
1.06 (0.54) |
0.92 (0.27) |
** |
0.09 (0.29) |
-0.58 (0.27) |
* |
-0.17 (0.45) |
0.03 (0.28) |
||||
|
Age |
0.06 (0.04) |
0.02 (0.02) |
-0.02 (0.02) |
-0.07 (0.02) |
** |
0.05 (0.04) |
-0.04 (0.02) |
||||||
|
Education |
0.16 (0.28) |
0.02 (0.12) |
0.31 (0.14) |
* |
-0.17 (0.13) |
0.34 (0.26) |
0.17 (0.13) |
||||||
|
Income |
0.31 (0.14) |
* |
0.00 (0.04) |
0.07 (0.05) |
0.09 (0.05) |
* |
0.11 (0.10) |
-0.05 (0.05) |
|||||
|
Preretirement PC use |
0.73 (0.54) |
0.49 (0.34) |
0.58 (0.35) |
0.46 (0.35) |
0.53 (0.48) |
-0.47 (0.36) |
|||||||
|
Social |
Relationship status |
-0.28 (0.58) |
0.26 (0.28) |
-0.24 (0.32) |
0.05 (0.29) |
-0.33 (0.50) |
-0.07 (0.30) |
||||||
|
Frequency of use by f&f |
0.63 (0.22) |
** |
0.01 (0.13) |
0.09 (0.14) |
0.17 (0.13) |
0.28 (0.19) |
-0.09 (0.14) |
||||||
|
Encouragement by f&f |
-0.18 (0.28) |
0.09 (0.15) |
0.11 (0.16) |
0.06 (0.16) |
-0.42 (0.26) |
0.36 (0.15) |
* |
||||||
|
Model context |
Frequency of use |
2.19 (0.53) |
*** |
1.78 (0.34) |
*** |
1.61 (0.34) |
*** |
1.43 (0.40) |
*** |
1.80 (0.46) |
*** |
1.40 (0.33) |
*** |
|
Skills |
1.40 (0.40) |
** |
0.42 (0.19) |
* |
0.56 (0.21) |
** |
1.05 (0.21) |
*** |
0.75 (0.32) |
* |
0.47 (0.20) |
* |
|
|
Benefits |
-0.05 (0.22) |
0.12 (0.11) |
0.00 (0.13) |
0.09 (0.11) |
-0.07 (0.19) |
0.19 (0.12) |
|||||||
|
Constant |
-12.25 (3.97) |
** |
-6.34 (2.02) |
** |
-3.01 (2.16) |
-0.26 (2.07) |
-4.89 (3.42) |
-0.03 (2.01) |
|||||
|
N |
460 |
454 |
449 |
456 |
462 |
456 |
|||||||
|
Nagelkerke’s R2 |
.511 |
.210 |
.296 |
.377 |
.330 |
.207 |
|||||||
|
Correct |
93.5% |
73.7% |
79.0% |
72.8% |
93.1% |
76.7% |
*p < .05 **p < .01 ***p < .001; f&f: friends and family
7 Discussion
The findings regarding the relevant factors for digital inequalities among older adults with respect to access, frequency of use, skills, diversity of use, and benefits (RQ1) largely support the respective hypotheses. If significant, the effect of the hypothesized factors is consistently in the assumed direction. Male gender (H1), younger age (H2), higher education (H3), higher income (H4), preretirement PC use (H5), having a higher frequency of Internet use in the social context (H7), and being encouraged by the social context (H8) are positively associated with the various dimensions. The only exception is the relationship status. Based on the literature, a positive effect was assumed for being in a relationship (H6). However, no such influence was found for any of the five dimensions. The fact that the frequency of Internet use and encouragement of life partners is covered in the other two variables regarding the social context (H7 and H8) might explain this finding.
Beyond these findings for the different factors and the respective hypotheses, the results revealed a broader pattern: The individual context seems to be relevant for inequalities of access and frequency of use, while the social context seems to be crucial for understanding inequalities regarding skills, the diversity of use, and beneficial outcomes. This result is in line with findings by Hargittai and Dobransky (2017) for older adults in the United States: They found significant effects of gender on access and skills but no consistent effect on benefits. These results confirm other findings (Helsper & van Deursen, 2017) and show that there are good empirical arguments for including the social context that is often left out in digital inequality research (Scheerder et al., 2017). Furthermore, it is shown that by distinguishing five dimensions of digital inequality, a more nuanced picture emerges regarding the general finding that offline social capital and social support are related to digital inequality (Courtois & Verdegem, 2016). When it comes to the beneficial outcomes of Internet use, the sole direct influence comes from the social context. Both frequency of use and encouragement by friends and family are positively associated with benefits. In particular, the positive relationship with email use is highly plausible, as email is a classic example of positive network externalities—that is, that the gain of using a specific service increases due to another person’s use (Shapiro & Varian, 1998).
The second research question (RQ2) addressed the relationships among the dimensions and factors that are linked to inequality. This included the assumption that frequency of use, skills, diversity of use, and the resulting benefits are logically dependent on having Internet access and therefore suggest a hierarchical relationship. However, for all other dimensions, no such hierarchical order was assumed. Empirical support for these mutual dependencies in the non-hierarchical part of the mixed model is provided by the significant effects from one dimension on another. In both Tables 2 and 3, the model context includes each dimension as an independent variable in the regressions of the other dimensions. The statistically significant effects for three of the six relationships reveal multiple interdependencies. Regarding the relationships between the dimensions, we found empirical evidence for all four suggested types: maintaining (e.g., income), reinforcing (e.g., age), mitigating (e.g., gender), and modifying (e.g., encouragement by friends and family) relationships. Of course, the underlying assumption of a causal effect from the various factors on the dimension need to be assessed critically since the cross-sectional design does not allow to test these empirically. However, regarding gender, age, and preretirement computer use this causal assumption is plausible.
A maintaining effect is especially powerful in a hierarchical model, such as the relationships between access and the other dimensions. In this study, we found that income is positively related with Internet access but is not related with any other dimension. If we assume that income is more likely to affect Internet use and not the other way round, this means that the influence of income is limited to access and has no effect on inequality once older adults are online. However, this also implies that the inequality created by this access gap is maintained onto the other dimensions if it is not addressed.
Empirical evidence for a reinforcing effect is given if a variable has a significant effect in the same direction (i.e., same sign) in two dimensions. This is the case for gender (i.e., a negative effect on frequency of use and skills), age (i.e., a negative effect on access, frequency of use, and diversity of use), preretirement computer use (i.e., a positive effect on access, skills, and diversity of use), frequency of Internet use by friends and family (i.e., a positive effect on diversity of use and benefits), and encouragement by friends and family (i.e., a positive effect on access, skills, and benefits). This means that the influence of a factor is potentially increasing across the dimensions. At the same time, these causes are difficult to be addressed because if an inequality in one dimension is addressed and successfully diminished, the inequality may still prevail in other dimensions.
In addition, we must emphasize the relevance of potential mitigating effects. A mitigating relationship between inequality dimensions adds a perspective to the literature on digital inequality that is rarely considered. This effect refers to the decrease in inequalities if additional dimensions are taken into account. No such effect was found for the five general dimensions. The picture becomes more nuanced, however, when we distinguish the different types of content (Table 3). In addition to the reinforcing effect for e-commerce (women use the Internet less frequently, and this inequality is increased for e-commerce content), we found a mitigating effect for health information. This means that although women use the Internet less frequently overall, those who are online are more likely to use health-related information compared to men. Consequently, the inequality found regarding access (lower access for women) may thus turn out to be less pronounced if other dimensions are considered as the relevant dependent variable (such as the use of health information). However, this also means that reducing the inequality in one dimension may increase the inequality in another dimension. Continuing the example of health information this would mean that reducing the access gap would increase the inequality of health-related Internet use and thereby disadvantaging males.
Finally, a modifying effect describes the combination of the effects two factors have in multiple dimensions. We found modifying effects for the factors of gender and age regarding inequalities of skills and diversity of use. While gender has an effect on skills (women report fewer skills), it has no effect on the diversity of use. Age, on the other hand, does not predict skills but has a negative effect on the diversity of use. Due to the positive relationship between the dimensions of skills and diversity of use, we can consider the inequality in both dimensions modified by the respective other. For example, the age groups need to be split by gender in order to understand the interaction of the two factors across the two dimensions. Thereby it is found that older women among the older adults might be especially disadvantaged because they have fewer skills and use a less diverse set of content.
The overall explanatory power of the models varies between 19.0% and 55.2%. A potential explanation for the differences in explained variance is that some dimensions of Internet use are very clearly defined (i.e., access, frequency of use, email use), while others allow a bit more freedom of interpretation (i.e., benefits, health information, media). The effect strength on the dimension of access was very close to the findings for Switzerland from 2009 (Friemel, 2016). Hence, the results reveal a pattern that remains quite stable over time. This temporal stability can be regarded as either an indicator for inappropriate or ineffective intervention strategies in the past or an opportunity for future interventions, since these typically take some time from development to implementation.
Based on our mixed model that considers Internet access as a prerequisite for the other (non-hierarchically ordered) dimensions of digital inequality, the negative influence of income and its maintaining effects on the subsequent dimensions play a crucial role in any policy intervention. Digital inequality may be reduced in all dimensions if the costs associated with Internet access can be reduced for older adults. However, current strategies such as free Wi-Fi in public places are unlikely to be effective, since older adults are less likely than younger generations to use mobile devices (Eurostat, 2016). Therefore, we suggest that more specific interventions such as a tax deduction for Internet access at home or subsidies for providers offering special plans for seniors should be assessed. The relevancy to address digital inequalities among older adults on the dimension of access becomes even more apparent when the reinforcing negative effect related to gender, age, preretirement computer use, Internet use by friends and family, and social encouragement is considered. Furthermore, the relevancy of the social context suggests designing social marketing campaigns that motivate friends and family to support and encourage older adults regarding Internet use.
8 Limitations
Of course, our empirical design comes with some limitations. First, a cross-sectional design does not allow to test causal relationships empirically. However, for several relationships it is plausible to assume a specific causal direction (e.g., gender, age, education, and preretirement PC use). With respect to the social context this is less clear, and the influence might also occur in the reverse direction. Family and friends might be more encouraging if they perceive a person as a savvy user. Therefore, respective “effects” must be understood in their statistical sense and not as causal cause of an effect. Second, our empirical design is limited to a specific country and a specific societal group. However, the descriptive findings regarding the relevant factors for digital inequalities among older adults are in line with the findings from other countries and studies in Switzerland. Furthermore, the theoretical approach that suggest a multidimensional perspective on digital inequalities is not limited to older adults but can be applied to all settings.
9 Conclusions
The findings show that Internet use among older Swiss adults is driven by the individual context (age, gender, education, and income) and related to the social context (Internet use and encouragement by family and friends). Our findings regarding the role of the social context support previous findings and show a positive association between Internet use as well as encouragement by family and friends and older adults Internet use. This suggests including this factor in all future studies and thinking about alternative methodological approaches and more differentiated theoretical models to investigate this aspect. With respect to intervention strategies, this suggests focusing more on the social context, which was found to be related in all inequality dimensions (access, frequency of use, skills, diversity of use, and benefits).
The second contribution of this article is the theoretical advances it offers regarding multidimensional models of digital inequality. This starts with the reflection regarding the hierarchical and non-hierarchical structure of current models and the proposition of a mixed model of digital inequalities. It is argued that assumptions of a sequential order and the related causal effects between the dimensions should only be made with great caution unless there are solid theoretical assumptions such as logical dependencies or longitudinal research designs. Furthermore, the explicit multidimensional approach guides the attention toward relationships between the dimensions and suggests distinguishing among maintaining, reinforcing, mitigating, and modifying relationships between the dimensions. This typology of relationships in a multidimensional approach has several implications for the theoretical understanding, empirical investigation, and policy advice regarding digital inequality. Comparing the effect size in a single dimension is unlikely to provide a comprehensive picture, and not all dimensions may be equally important. In a hierarchical model, the factors that have a significant effect in a basal dimension may be more important to address, since the inequality caused in an early stage will be maintained in all subsequent dimensions. Furthermore, factors that influence multiple dimensions at the same time deserve special attention. The impact of weak influences on different dimensions may easily be underestimated if they exert their influence in a reinforcing way across multiple dimensions. In cases of mitigating and modifying effects, special caution is required. In these instances, the decrease of inequality in one dimension may increase inequality in other dimensions. Hence, more sophisticated definitions of the target groups are required that take the relevant factors in other dimensions into account.
In sum, our theoretical reasoning and our empirical findings suggest advancing research on digital inequality by including several dimensions at a time and striving for research designs that provide a deeper insight into the social and temporal dynamics of Internet use. This is not only crucial regarding older adults but for any setting in which inequalities are found on multiple dimensions. Given the steady innovation of new technologies and online services, the number of such settings is likely to increase. Hence, the multidimensional perspective will become important for dimensions and societal groups that are currently less in the spotlight of researchers.
Antonucci, T. C., Ajrouch, K. J., & Manalel, J. A. (2017). Social relations and technology: Continuity, context, and change. Innovation in Aging, 1 (3), 1–9. https://doi.org/10.1093/geroni/igx029
Baller, S., Dutta, S., & Lanvin, B. (2016). The global information technology report 2016: Innovating in the digital economy. Insight report. Montreal: World Economic Forum.
BFS (2020). Internetnutzung in der Schweiz nach Alter, Entwicklung. https://www.bfs.admin.ch/bfsstatic/dam/assets/14941639/master
Bonfadelli, H. (2002). The Internet and knowledge gaps. A theoretical and empirical investigation. European Journal of Communication, 17 (1), 65–84. https://doi.org/10.1177/0267323102017001607
Compaine, B. M. (2001). The digital divide: Facing a crisis or creating a myth? Cambridge: MIT Press. https://doi.org/10.1080/01972240290108212
Courtois, C., & Verdegem, P. (2016). With a little help from my friends: An analysis of the role of social support in digital inequalities. New Media & Society, 18 (8), 1508–1527. https://doi.org/10.1177/1461444814562162
de Haan, J., & Iedema, J. (2006). Models of access to the information society. The Netherlands Institute for Social Science. Retrieved from https://www.researchgate.net/publication/267025673
Dobransky, K., & Hargittai, E. (2006). The disability divide in Internet access and use. Information, Communication & Society, 9 (3), 313–334. https://doi.org/10.1080/13691180600751298
Eurostat. (2019). Individuals – Internet use. Retrieved from http://appsso.eurostat.ec.europa.eu/nui/show.do?dataset=isoc_ci_ifp_iu&lang=en
Eurostat. (2016). Internet use by individuals. Retrieved from https://ec.europa.eu/eurostat/documents/2995521/7771139/9-20122016-BP-EN.pdf/f023d81a-dce2-4959-93e3-8cc7082b6edd
Fernstrom, K., Henderson, M., Shurville, S., Whitefield, D., Whitefield, T., Ktoridou, D., & Eteokleous-Grigoriou, N. (2011). Developing digital immigrants’ computer literacy: The case of unemployed women. Campus-Wide Information Systems, 28 (3), 154–163. https://doi.org/10.1108/10650741111145689
Friemel, T. N. (2016). The digital divide has grown old: Determinants of a digital divide among seniors. New Media & Society, 18 (2), 313–331. https://doi.org/10.1177/1461444814538648
Hargittai, E. (2002). Second-level digital divide: Differences in people’s online skills. First Monday, 7(4). https://doi.org/10.5210/fm.v7i4.942
Hargittai, E. (2008). The digital reproduction of inequality. In D. Grusky (Ed.), Social stratification (3rd ed.) (pp. 936–944). Boulder, CO: Westview Press.
Hargittai, E., & Dobransky, K. (2017). Old dogs, new clicks: Digital inequality in skills and uses among older adults. Canadian Journal of Communication, 42 (2), 195–212. https://doi.org/10.22230/cjc2017v42n2a3176
Helsper, E. J. (2010). Gendered Internet use across generations and life stages. Communication Research, 37 (3), 1–23. https://doi.org/10.1177/0093650209356439
Helsper, E. J. (2012). A corresponding fields model for the links between social and digital exclusion. Communication Theory, 22, 403–426. https://doi.org/10.1111/j.1468-2885.2012.01416.x
Helsper, E. J., & van Deursen, A. J. A. M. (2017). Do the rich get digitally richer? Quantity and quality of support for digital engagement. Information, Communication & Society, 20 (5), 700–714. https://doi.org/10.1080/1369118X.2016.1203454
Hunsaker, A., & Hargittai, E. (2018). A review of Internet use among older adults. New Media & Society, 20 (10), 3937–3954. https://doi.org/10.1177/1461444818787348
Hunsaker, A., Nguyen, M. H., Fuchs, J., Djukaric, T., Hugentobler, L., & Hargittai, E. (2019). “He explained it to me and I also did it myself”: How older adults get support with their technology uses. Socius: Sociological Research for a Dynamic World, 5 (2), 1–13. https://doi.org/10.1177/2378023119887866
International Telecommunication Union (ITU). (2019). Measuring digital development. ICT price trends. Retrieved from https://www.itu.int/en/ITU-D/Statistics/Pages/ICTprices
Jung, Y., Peng, W., Moran, M., Jin, S.-A. A., McLaughlin, M., Cody, M., Jordan-Marsh, M., Albright, J., & Silverstein, M. (2010). Low-income minority seniors’ enrollment in a cybercafé: Psychological barriers to crossing the digital divide. Educational Gerontology, 36 (3), 193–212. https://doi.org/10.1080/03601270903183313
König, R., Seifert, A., & Doh, M. (2018). Internet use among older Europeans: An analysis based on SHARE data. Universal Access in the Information Society, 1–3. https://doi.org/10.1007/s10209-018-0609-5
Korupp, S. E., & Szydlik, M. (2005). Causes and trends of the digital divide. European Sociological Review, 21 (4), 409–422. https://doi.org/10.1093/esr/jci030
Kvasny, L. (2006). Cultural (re)production of digital inequality in a US community technology initiative. Information, Communication & Society, 9(2), 160–181, https://doi.org/10.1080/13691180600630740
Lengsfeld, J. H. B. (2011). An econometric analysis of the sociodemographic topology of the digital divide in Europe. The Information Society, 27 (3), 141–157. https://doi.org/10.1080/01972243.2011.566745
National Telecommunications and Information Administration (NTIA). (1995). Falling through the net: Defining the digital divide, a report on the telecommunications and information technology gap in America. Retrieved from https://www.ntia.doc.gov/report/1995/falling-through-net-survey-have-nots-rural-and-urban-america-html
Nimrod, G. (2010). Seniors’ online communities: A quantitative content analysis. The Gerontologist, 50 (3), 382–392. https://doi.org/10.1093/geront/gnp141
Nimrod, G. (2016). Older audiences in the digital media environment. Information, Communication & Society, 20(2), 233–249. https://doi.org/10.1080/1369118X.2016.1164740
Norris, P. (2001). Digital divide: Civic engagement, information poverty, and the Internet worldwide. Cambridge: Cambridge University Press.
Olson, K. E., O’Brien, M. A., Rogers, W. A., & Charness, N. (2011). Diffusion of technology: Frequency of use for younger and older adults. Ageing International, 36 (1), 123–145. https://doi.org/10.1007/s12126-010-9077-9
Quan-Haase, A., Martin, K., & Schreurs, K. (2016). Interviews with digital seniors: ICT use in the context of everyday life. Information, Communication & Society, 19 (5), 691–707. https://doi.org/10.1080/1369118X.2016.1140217
Scheerder, A., van Deursen, A. J. A. M., & van Dijk, J. A. G. M. (2017). Determinants of Internet skills uses and outcomes. A systematic review of the second- and third-level digital divide. Telematics and Informatics, 34 (8), 1607–1624. https://doi.org/10.1016/j.tele.2017.07.007
Seifert, A., & Schelling, H. R. (2015). Digitale Senioren. Zürich: Pro Senectute Schweiz.
Seifert, A., & Schelling, H. R. (2018). Seniors online: Attitudes toward the Internet and coping with everyday life. Journal of Applied Gerontology, 37(1), 99–109. https://doi.org/10.1177/0733464816669805
Seifert, A., Cotten, S. R., & Xie, B. (2021). A Double Burden of Exclusion? Digital and Social Exclusion of Older Adults in Times of COVID-19. The Journals of Gerontology: Series B, 76(3), e99–e103. https://doi.org/10.1093/geronb/gbaa098
Selwyn, N. (2004). Reconsidering political and popular understandings of the digital divide. New Media & Society, 6 (3), 341–362. https://doi.org/10.1177/1461444804042519
Shapiro, C., & Varian, H. R. (1998). Information rules: A strategic guide to the network economy. Boston: Harvard Business Review Press.
Sum, S., Mathews, M. R., Pourghasem, M., & Hughes, I. (2008). Internet technology and social capital: How the Internet affects seniors’ social capital and wellbeing. Journal of Computer-Mediated Communication, 14 (1), 202–220. https://doi.org/10.1111/j.1083-6101.2008.01437.x
Tirado-Morueta, R., Mendoza-Zambrano, D. M., Aguaded-Gómez, J. I., & Marín-Gutiérrez, I. (2017). Empirical study of a sequence of access to Internet use in Ecuador. Telematics and Informatics, 34 (4), 171–183. https://doi.org/10.1016/j.tele.2016.12.012
United Nations. (2017). World population prospects: The 2017 revision. Working paper no. ESA/P/WP/248. New York: United Nations.
van Deursen, A. J. A. M., & Helsper, E. J. (2015). The third-level digital divide: Who benefits most from being online? Communication and Information Technologies Annual, 10 , 29–52. https://doi.org/10.1108/S2050-206020150000010002
van Deursen, A. J. A. M., & Helsper, E. J. (2017). Collateral benefits of Internet use: Explaining the diverse outcomes of engaging with the Internet. New Media & Society, 18 (11), 1–19. https://doi.org/10.1177/1461444817715282
van Deursen, A. J. A. M., Helsper, E. J., Eynon, R., & van Dijk, J. A. G. M. (2017). The Compoundness and Sequentiality of Digital Inequality. International Journal of Communication, 11, 452-473. https://ijoc.org
van Deursen, A. J. A. M., & van Dijk, J. A. G. M. (2011). Internet skills and the digital divide. New Media & Society, 13 (6), 893–911. https://doi.org/10.1177/1461444810386774
van Deursen, A. J. A. M., & van Dijk, J. A. G. M. (2015). Toward a multifaceted model of Internet access for understanding digital divides: An empirical investigation. The Information Society, 31 (5), 379–391. https://doi.org/10.1080/01972243.2015.1069770
van Dijk, J. A. G. M. (2005). The deepening divide. Inequality in the information society. Thousand Oaks: Sage Publications.
Warschauer, M. (2003). Demystifying the digital divide. Scientific American, 289(2), 42–47.
Wei, L. (2012). Number Matters: The Multimodality of Internet Use as an Indicator of the Digital Inequalities. Journal of Computer-Mediated Communication, 17(3), 303–318. https://doi.org/10.1111/j.1083-6101.2012.01578.x
Wei, K., Teo, H., Chan, H. C., & Tan, B. C. Y. (2011). Conceptualizing and testing a social cognitive model of the digital divide. Information Systems Research, 22 (1), 170–187. https://doi.org/10.1287/isre.1090.0273
Xie, B. (2011). Effects of an eHealth literacy intervention for older adults. Journal of Medical Internet Research, 13 (4), e90. https://doi.org/10.2196/jmir.1880
Date received: June 2021
Date accepted: October 2021
Appendix
Table 4: Zero-Order Correlations for All Variables
|
(1) |
(2) |
(3) |
(4) |
(5) |
(6) |
(7) |
(8) |
(9) |
(10) |
(11) |
(12) |
(13) |
(14) |
(15) |
(16) |
(17) |
(18) |
|||||||||||||||||||
|
(1) Gender |
1.00 |
*** |
.04 |
-.29 |
*** |
-.26 |
*** |
-.22 |
*** |
-.34 |
*** |
-.03 |
-.05 |
-.15 |
*** |
-.25 |
*** |
-.18 |
*** |
-.13 |
*** |
-.02 |
.07 |
-.14 |
** |
-.21 |
*** |
-.10 |
* |
-.08 |
||||||
|
(2) Age |
1.00 |
*** |
-.16 |
*** |
-.16 |
*** |
-.39 |
*** |
-.20 |
*** |
-.36 |
*** |
-.22 |
*** |
-.20 |
*** |
-.44 |
*** |
-.25 |
*** |
-.08 |
* |
-.10 |
* |
-.10 |
* |
-.15 |
*** |
-.21 |
*** |
-.10 |
* |
-.14 |
** |
||
|
(3) Education |
1.00 |
*** |
.41 |
*** |
.29 |
*** |
.10 |
** |
.24 |
*** |
.15 |
*** |
.15 |
*** |
.39 |
*** |
.21 |
*** |
.11 |
** |
.21 |
*** |
.01 |
.23 |
*** |
.13 |
** |
.18 |
*** |
.11 |
* |
|||||
|
(4) Income |
1.00 |
*** |
.31 |
*** |
.36 |
*** |
.25 |
*** |
.19 |
*** |
.20 |
*** |
.40 |
*** |
.23 |
*** |
.14 |
*** |
.21 |
*** |
.06 |
.24 |
*** |
.24 |
*** |
.19 |
*** |
.05 |
||||||||
|
(5) Preretirement PC use |
1.00 |
*** |
.17 |
*** |
.27 |
*** |
.31 |
*** |
.25 |
*** |
.62 |
*** |
.30 |
*** |
.16 |
*** |
.29 |
*** |
.15 |
*** |
.23 |
*** |
.24 |
*** |
.18 |
*** |
.07 |
|||||||||
|
(6) Relationship status |
1.00 |
*** |
.11 |
** |
-.01 |
.14 |
*** |
.17 |
*** |
.06 |
.04 |
.09 |
* |
.00 |
.06 |
.11 |
* |
.11 |
** |
-.03 |
||||||||||||||||
|
(7) Frequency of use by f&f |
1.00 |
*** |
.42 |
*** |
.09 |
* |
.38 |
*** |
.28 |
*** |
.27 |
*** |
.19 |
*** |
.12 |
** |
.21 |
*** |
.21 |
*** |
.15 |
** |
.15 |
*** |
||||||||||||
|
(8) Encouragement by f&f |
1.00 |
*** |
.12 |
** |
.43 |
*** |
.16 |
*** |
.36 |
*** |
.05 |
.13 |
** |
.14 |
** |
.13 |
** |
.02 |
.18 |
*** |
||||||||||||||||
|
(9) Frequency of use by ego |
1.00 |
*** |
.46 |
*** |
.51 |
*** |
.21 |
*** |
.40 |
*** |
.33 |
*** |
.36 |
*** |
.33 |
*** |
.31 |
*** |
.31 |
*** |
||||||||||||||||
|
(10) Skills |
1.00 |
*** |
.57 |
*** |
.30 |
*** |
.42 |
*** |
.27 |
*** |
.35 |
*** |
.41 |
*** |
.30 |
*** |
.28 |
*** |
||||||||||||||||||
|
(11) Diversity of use |
1.00 |
*** |
.30 |
*** |
.45 |
*** |
.52 |
*** |
.61 |
*** |
.61 |
*** |
.54 |
*** |
.57 |
*** |
||||||||||||||||||||
|
(12) Benefits |
1.00 |
*** |
.10 |
* |
.20 |
*** |
.18 |
*** |
.23 |
*** |
.14 |
** |
.21 |
*** |
||||||||||||||||||||||
|
(13) Email |
1.00 |
*** |
.27 |
*** |
.34 |
*** |
.24 |
*** |
.35 |
*** |
.21 |
*** |
||||||||||||||||||||||||
|
(14) Health information |
1.00 |
*** |
.36 |
*** |
.25 |
*** |
.31 |
*** |
.25 |
*** |
||||||||||||||||||||||||||
|
(15) E-government information |
1.00 |
*** |
.31 |
*** |
.42 |
*** |
.31 |
*** |
||||||||||||||||||||||||||||
|
(16) E-commerce |
1.00 |
*** |
.31 |
*** |
.27 |
*** |
||||||||||||||||||||||||||||||
|
(17) Mobility |
1.00 |
*** |
.25 |
*** |
||||||||||||||||||||||||||||||||
|
(18) Media |
1.00 |
*** |
n = 560-1035; .001 **p < .01, *p < .05, f&f: friends and family
Table 5: Effect sizes (Cohen’s f2) for the Logistic and Linear Regressions for Digital Inequalities in Multiple Dimensions
|
Access |
Frequency of use |
Skills |
Diversity of use |
Benefits |
||
|
Individual context |
Gender |
− |
0.04 |
0.01 |
− |
− |
|
Age |
0.12 |
0.05 |
− |
0.01 |
− |
|
|
Education |
0.05 |
− |
− |
− |
− |
|
|
Income |
0.04 |
− |
− |
− |
− |
|
|
Preretirement PC use |
0.11 |
− |
0.03 |
0.01 |
− |
|
|
Social context |
Relationship status |
− |
− |
− |
− |
− |
|
Frequency of use by f&f |
− |
− |
− |
0.01 |
0.01 |
|
|
Encouragement by f&f |
0.03 |
− |
0.00 |
− |
0.05 |
|
|
Model context |
Frequency of use by ego |
− |
− |
0.19 |
− |
|
|
Skills |
− |
− |
− |
0.13 |
0.02 |
|
|
Diversity of use |
− |
0.35 |
0.06 |
− |
− |
|
|
Benefits |
− |
− |
0.00 |
− |
− |
f&f: friends and family
Table 6: Effect sizes (Cohen’s f2) for the Logistic Regressions for Specific Types of Content
|
|
Health information |
E-government information |
E-commerce |
Mobility |
Media |
||
|
Individual context |
Gender |
− |
0.04 |
− |
0.02 |
− |
− |
|
Age |
− |
− |
− |
0.03 |
− |
− |
|
|
Education |
− |
− |
0.02 |
− |
− |
− |
|
|
Income |
0.14 |
− |
− |
0.06 |
− |
− |
|
|
Preretirement PC use |
− |
− |
− |
− |
− |
− |
|
|
Social context |
Relationship status |
− |
− |
− |
− |
− |
− |
|
Frequency of use by f&f |
0.19 |
− |
− |
− |
− |
− |
|
|
Encouragement by f&f |
− |
− |
− |
− |
− |
0.01 |
|
|
Model context |
Frequency of use |
0.26 |
0.11 |
0.10 |
0.06 |
0.11 |
0.07 |
|
Skills |
0.29 |
0.02 |
0.03 |
0.11 |
0.04 |
0.02 |
|
|
Benefits |
− |
− |
− |
− |
− |
− |
f&f: friends and family